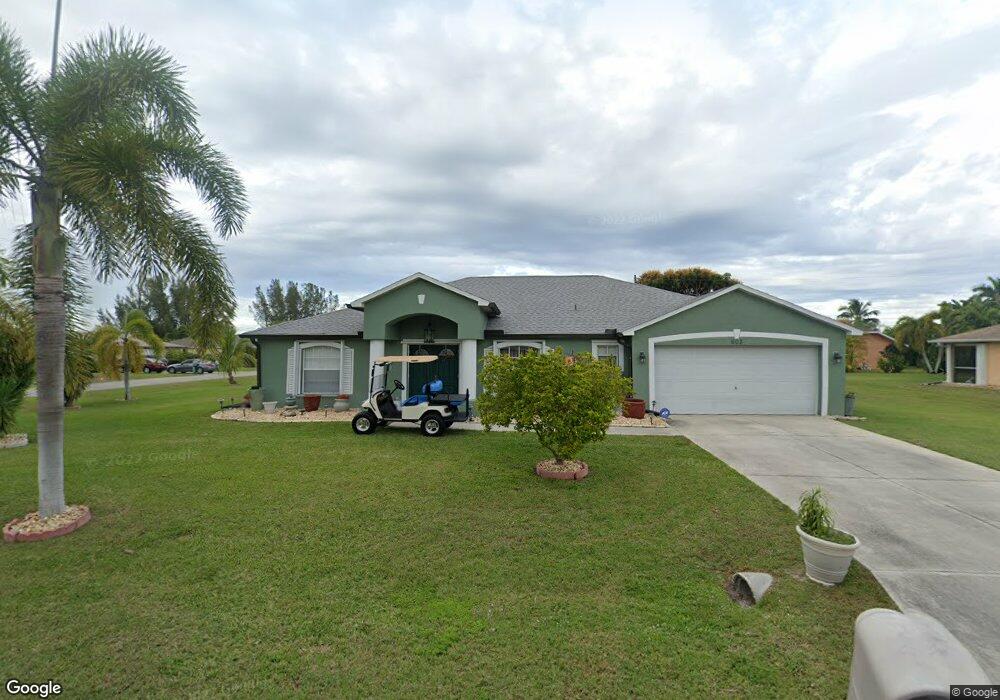
603 SE 30th Ln Cape Coral, FL 33904
Caloosahatchee NeighborhoodEstimated Value: $337,309 - $420,000
3
Beds
2
Baths
2,451
Sq Ft
$160/Sq Ft
Est. Value
About This Home
This home is located at 603 SE 30th Ln, Cape Coral, FL 33904 and is currently estimated at $392,827, approximately $160 per square foot. 603 SE 30th Ln is a home located in Lee County with nearby schools including Caloosa Elementary School, Cape Elementary School, and Tropic Isles Elementary School.
Ownership History
Date
Name
Owned For
Owner Type
Purchase Details
Closed on
Nov 1, 2004
Sold by
Maldonado Fernando R and Maldonado Toni A
Bought by
Maloney Martin Joseph and Makarova Maloney Viera
Current Estimated Value
Purchase Details
Closed on
Mar 16, 2001
Sold by
Holiday Builders Inc
Bought by
Maldonado Fernando R and Maldonado Toni A
Home Financials for this Owner
Home Financials are based on the most recent Mortgage that was taken out on this home.
Original Mortgage
$92,150
Interest Rate
7.11%
Purchase Details
Closed on
Sep 11, 2000
Sold by
Hodges Christopher R and Bishop Julie
Bought by
Holiday Bldr Inc
Purchase Details
Closed on
Sep 1, 1999
Sold by
Gamble Hugh G and Gamble Ruth M
Bought by
Hodges Christopher R and Bishop Julie
Create a Home Valuation Report for This Property
The Home Valuation Report is an in-depth analysis detailing your home's value as well as a comparison with similar homes in the area
Home Values in the Area
Average Home Value in this Area
Purchase History
| Date | Buyer | Sale Price | Title Company |
|---|---|---|---|
| Maloney Martin Joseph | $217,500 | Cape Coral Title Insurance A | |
| Maldonado Fernando R | $115,200 | -- | |
| Holiday Bldr Inc | $14,500 | -- | |
| Hodges Christopher R | -- | -- | |
| Hodges Christopher R | $8,071 | -- |
Source: Public Records
Mortgage History
| Date | Status | Borrower | Loan Amount |
|---|---|---|---|
| Previous Owner | Holiday Bldr Inc | $60,000 | |
| Previous Owner | Holiday Bldr Inc | $115,000 | |
| Previous Owner | Maldonado Fernando R | $92,150 |
Source: Public Records
Tax History Compared to Growth
Tax History
| Year | Tax Paid | Tax Assessment Tax Assessment Total Assessment is a certain percentage of the fair market value that is determined by local assessors to be the total taxable value of land and additions on the property. | Land | Improvement |
|---|---|---|---|---|
| 2025 | $2,347 | $129,673 | -- | -- |
| 2024 | $2,213 | $126,018 | -- | -- |
| 2023 | $2,213 | $122,348 | $0 | $0 |
| 2022 | $2,006 | $118,784 | $0 | $0 |
| 2021 | $1,973 | $239,882 | $38,749 | $201,133 |
| 2020 | $1,969 | $113,732 | $0 | $0 |
| 2019 | $1,900 | $111,175 | $0 | $0 |
| 2018 | $1,876 | $109,102 | $0 | $0 |
| 2017 | $1,851 | $106,858 | $0 | $0 |
| 2016 | $1,729 | $173,349 | $26,131 | $147,218 |
| 2015 | $1,714 | $153,106 | $18,392 | $134,714 |
| 2014 | $1,648 | $140,895 | $16,555 | $124,340 |
| 2013 | -- | $126,283 | $11,551 | $114,732 |
Source: Public Records
Map
Nearby Homes
- 3014 SE 6th Ave
- 3006 SE 6th Ave
- 601 SE 31st St
- 619 SE 30th Ln
- 3007 Academy Blvd
- 604 SE 31st Terrace
- 618 SE 28th Terrace
- 3101 SE 8th Ave
- 3021 SE 5th Ave
- 502 SE 31st St
- 418 SE 31st St
- 610 W Archer Pkwy
- 3137 SE 8th Ave
- 324 SE 30th St
- 539 W Archer Pkwy
- 419 SE 28th Terrace
- 321 SE 31st St
- 3208 SE 5th Ave
- 2728 SE 8th Ave
- 513 SE 27th Terrace
- 607 SE 30th Ln
- 602 SE 30th St
- 608 SE 30th St Unit 25
- 602 SE 30th Ln
- 611 SE 30th Ln
- 3014 SE 6th Ave Unit 50
- 608 SE 30th Ln
- 612 SE 30th St
- 3018 SE 6th Ave
- 3002 SE 6th Ave
- 612 SE 30th Ln
- 615 SE 30th Ln
- 3022 SE 6th Ave
- 616 SE 30th St
- 601 SE 30th St
- 607 SE 30th St
- 607 SE 31st St
- 616 SE 30th Ln
- 611 SE 31st St
- 611 SE 30th St