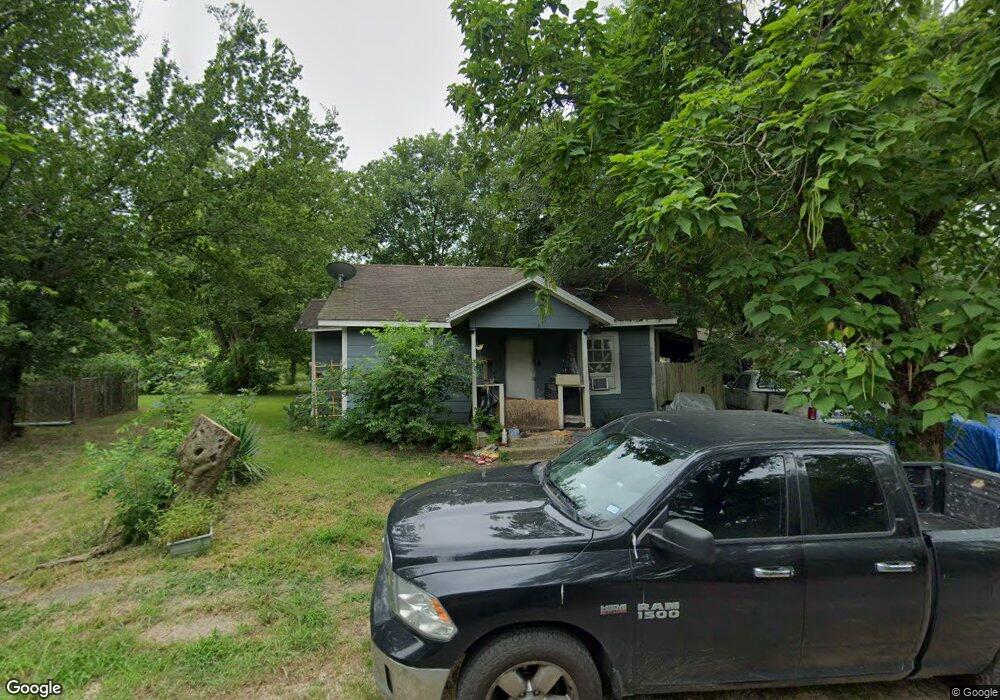
603 Smith St Commerce, TX 75428
Estimated Value: $115,309 - $174,000
Studio
1
Bath
1,128
Sq Ft
$117/Sq Ft
Est. Value
About This Home
This home is located at 603 Smith St, Commerce, TX 75428 and is currently estimated at $132,077, approximately $117 per square foot. 603 Smith St is a home located in Hunt County with nearby schools including Commerce Elementary School, Albert C Williams Elementary School, and Commerce Middle School.
Ownership History
Date
Name
Owned For
Owner Type
Purchase Details
Closed on
Nov 1, 2011
Sold by
Brookshire Michelle
Bought by
Pennington Larry
Current Estimated Value
Purchase Details
Closed on
Jul 8, 2011
Sold by
Pennington Larry
Bought by
Synodis Ray
Home Financials for this Owner
Home Financials are based on the most recent Mortgage that was taken out on this home.
Original Mortgage
$43,000
Interest Rate
4.15%
Mortgage Type
Seller Take Back
Purchase Details
Closed on
Oct 5, 2010
Sold by
Brookshire Michelle
Bought by
Pennington Larry
Home Financials for this Owner
Home Financials are based on the most recent Mortgage that was taken out on this home.
Original Mortgage
$7,000
Interest Rate
4.38%
Mortgage Type
Purchase Money Mortgage
Create a Home Valuation Report for This Property
The Home Valuation Report is an in-depth analysis detailing your home's value as well as a comparison with similar homes in the area
Home Values in the Area
Average Home Value in this Area
Purchase History
| Date | Buyer | Sale Price | Title Company |
|---|---|---|---|
| Pennington Larry | -- | None Available | |
| Synodis Ray | -- | None Available | |
| Pennington Larry | -- | None Available |
Source: Public Records
Mortgage History
| Date | Status | Borrower | Loan Amount |
|---|---|---|---|
| Previous Owner | Synodis Ray | $43,000 | |
| Previous Owner | Pennington Larry | $7,000 |
Source: Public Records
Tax History
| Year | Tax Paid | Tax Assessment Tax Assessment Total Assessment is a certain percentage of the fair market value that is determined by local assessors to be the total taxable value of land and additions on the property. | Land | Improvement |
|---|---|---|---|---|
| 2025 | $2,136 | $91,040 | $44,040 | $47,000 |
| 2024 | $2,136 | $91,660 | $44,040 | $47,620 |
| 2023 | $2,136 | $69,040 | $30,030 | $39,010 |
| 2022 | $1,599 | $57,460 | $14,170 | $43,290 |
| 2021 | $1,501 | $51,940 | $11,550 | $40,390 |
| 2020 | $1,293 | $43,070 | $4,310 | $38,760 |
| 2019 | $1,243 | $40,000 | $4,310 | $35,690 |
| 2018 | $1,006 | $32,100 | $4,310 | $27,790 |
| 2017 | $886 | $28,410 | $4,310 | $24,100 |
| 2016 | $841 | $26,970 | $4,310 | $22,660 |
Source: Public Records
Map
Nearby Homes
- Lot 1 Oak St
- Lot 3 Oak St
- Lot 5 Oak St
- Lot 4 Oak St
- Lot 2 Oak St
- Lot 6 Oak St
- TBD Lot 1-6 Oak St
- 405 3rd St
- 390 Bishop St
- 611 N Neal St
- 701 N Neal St
- Lot 7 N Neal St
- Lot 8 N Neal St
- Lot 12 N Neal St
- Lot 11 N Neal St
- Lot 10 N Neal St
- TBD Lots 7-12 N Neal St
- Lot 9 N Neal St
- 915 Jernigan St
- 816 Pine St
Your Personal Tour Guide
Ask me questions while you tour the home.