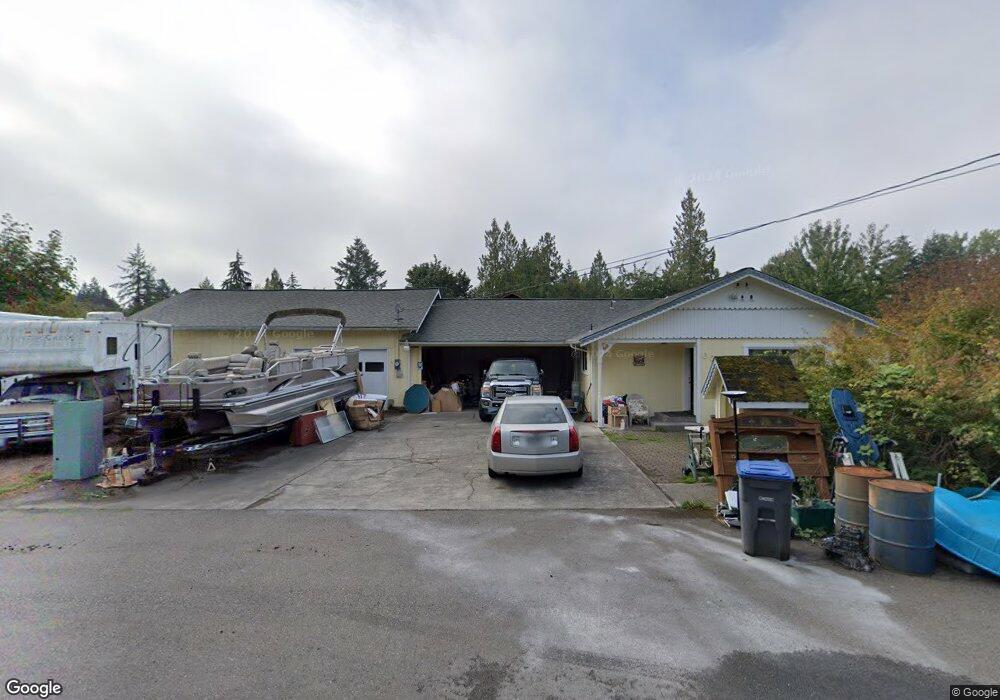
603 South St Port Orchard, WA 98366
Estimated Value: $451,000 - $523,000
3
Beds
2
Baths
1,248
Sq Ft
$380/Sq Ft
Est. Value
About This Home
This home is located at 603 South St, Port Orchard, WA 98366 and is currently estimated at $474,223, approximately $379 per square foot. 603 South St is a home located in Kitsap County with nearby schools including Sidney Glen Elementary School, Cedar Heights Middle School, and South Kitsap High School.
Ownership History
Date
Name
Owned For
Owner Type
Purchase Details
Closed on
Jun 17, 2004
Sold by
Pearson Betty A and Rogers Rebecca Sue
Bought by
Gibson Jeffrey A and Gibson Joanna M
Current Estimated Value
Home Financials for this Owner
Home Financials are based on the most recent Mortgage that was taken out on this home.
Original Mortgage
$151,960
Outstanding Balance
$69,867
Interest Rate
5.12%
Mortgage Type
Purchase Money Mortgage
Estimated Equity
$404,356
Purchase Details
Closed on
Mar 4, 2003
Sold by
Pearson Edward S
Bought by
Pearson Betty A and Pearson Rebecca Sue
Create a Home Valuation Report for This Property
The Home Valuation Report is an in-depth analysis detailing your home's value as well as a comparison with similar homes in the area
Home Values in the Area
Average Home Value in this Area
Purchase History
| Date | Buyer | Sale Price | Title Company |
|---|---|---|---|
| Gibson Jeffrey A | $189,950 | First American Title Ins | |
| Pearson Betty A | -- | -- |
Source: Public Records
Mortgage History
| Date | Status | Borrower | Loan Amount |
|---|---|---|---|
| Open | Gibson Jeffrey A | $151,960 | |
| Closed | Gibson Jeffrey A | $28,492 |
Source: Public Records
Tax History Compared to Growth
Tax History
| Year | Tax Paid | Tax Assessment Tax Assessment Total Assessment is a certain percentage of the fair market value that is determined by local assessors to be the total taxable value of land and additions on the property. | Land | Improvement |
|---|---|---|---|---|
| 2026 | $3,427 | $418,230 | $80,600 | $337,630 |
| 2025 | $3,427 | $392,750 | $66,020 | $326,730 |
| 2024 | $3,308 | $392,750 | $66,020 | $326,730 |
| 2023 | $3,306 | $392,750 | $66,020 | $326,730 |
| 2022 | $3,268 | $326,810 | $61,650 | $265,160 |
| 2021 | $3,086 | $292,570 | $57,290 | $235,280 |
| 2020 | $3,053 | $280,650 | $54,560 | $226,090 |
| 2019 | $2,373 | $238,840 | $53,580 | $185,260 |
| 2018 | $2,526 | $198,890 | $53,580 | $145,310 |
| 2017 | $2,180 | $198,890 | $53,580 | $145,310 |
| 2016 | $2,135 | $180,370 | $53,580 | $126,790 |
| 2015 | $2,067 | $177,450 | $53,580 | $123,870 |
| 2014 | -- | $174,530 | $53,580 | $120,950 |
| 2013 | -- | $178,490 | $56,390 | $122,100 |
Source: Public Records
Map
Nearby Homes
- 1408 West Ave
- 1325 Garrison Ave
- 1234 Garrison Ave
- 1350 SE Shelton Ln
- 2673 Harold Dr SE
- 1369 Sherman Ave
- 1330 SE Casandra Loop
- 410 Kendall St
- 155 May St W
- 108 Kendall St
- 0 Smith St
- 911 Hull Ave
- 252 Sage St
- 620 Hull Ave
- 912 Eagle Crest Place
- 0 Caseco Ln Unit NWM2428092
- 528 Dwight St
- 0 Lincoln Ave SE
- 3132 Harris Rd SE
- 2313 Lincoln Ave SE