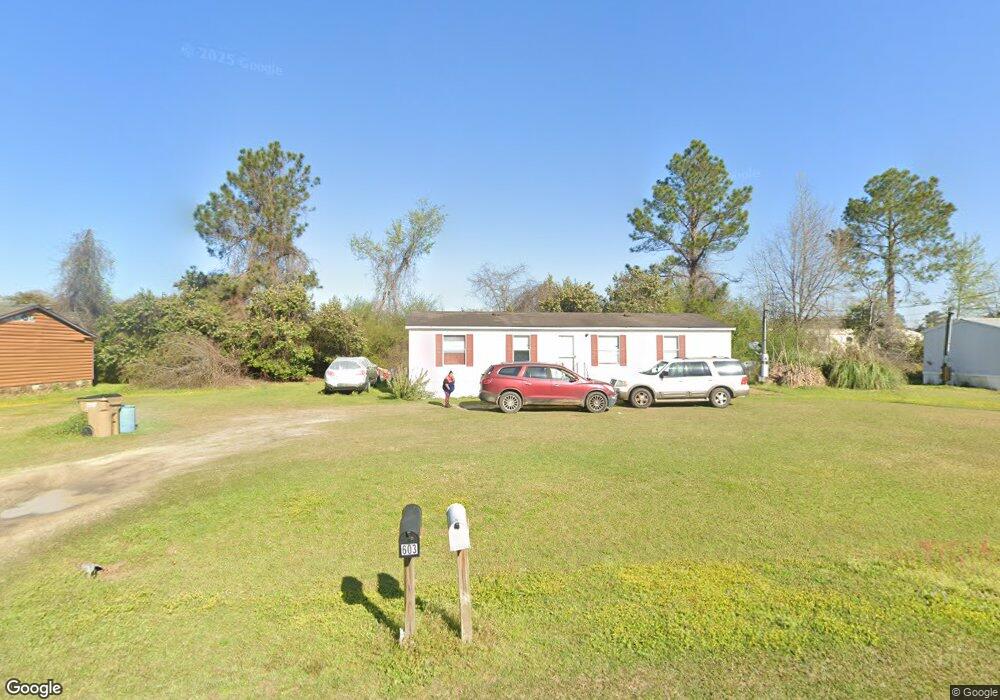
603 Sycamore Dr Sparks, GA 31647
Estimated Value: $106,000 - $120,000
--
Bed
1
Bath
1,097
Sq Ft
$103/Sq Ft
Est. Value
About This Home
This home is located at 603 Sycamore Dr, Sparks, GA 31647 and is currently estimated at $112,862, approximately $102 per square foot. 603 Sycamore Dr is a home located in Cook County with nearby schools including Cook Primary School, Cook Elementary School, and Cook County Middle School.
Ownership History
Date
Name
Owned For
Owner Type
Purchase Details
Closed on
Oct 14, 2016
Sold by
Cindis Properties Llc
Bought by
Hill Timothy
Current Estimated Value
Home Financials for this Owner
Home Financials are based on the most recent Mortgage that was taken out on this home.
Original Mortgage
$52,500
Outstanding Balance
$42,142
Interest Rate
3.5%
Mortgage Type
VA
Estimated Equity
$70,720
Purchase Details
Closed on
May 19, 2016
Sold by
Waller Hailey Dawn
Bought by
Cindis Properties Llc
Home Financials for this Owner
Home Financials are based on the most recent Mortgage that was taken out on this home.
Original Mortgage
$80,613
Interest Rate
3.59%
Mortgage Type
New Conventional
Purchase Details
Closed on
Nov 8, 2010
Sold by
Postell Cynthia J
Bought by
Waller Hailey
Purchase Details
Closed on
Jun 16, 2010
Sold by
Byron Maxine
Bought by
Postell Cynthia J
Create a Home Valuation Report for This Property
The Home Valuation Report is an in-depth analysis detailing your home's value as well as a comparison with similar homes in the area
Home Values in the Area
Average Home Value in this Area
Purchase History
| Date | Buyer | Sale Price | Title Company |
|---|---|---|---|
| Hill Timothy | $52,500 | -- | |
| Cindis Properties Llc | -- | -- | |
| Waller Hailey | -- | -- | |
| Postell Cynthia J | $39,000 | -- |
Source: Public Records
Mortgage History
| Date | Status | Borrower | Loan Amount |
|---|---|---|---|
| Open | Hill Timothy | $52,500 | |
| Previous Owner | Cindis Properties Llc | $80,613 |
Source: Public Records
Tax History Compared to Growth
Tax History
| Year | Tax Paid | Tax Assessment Tax Assessment Total Assessment is a certain percentage of the fair market value that is determined by local assessors to be the total taxable value of land and additions on the property. | Land | Improvement |
|---|---|---|---|---|
| 2024 | -- | $28,714 | $1,894 | $26,820 |
| 2023 | $872 | $24,696 | $1,692 | $23,004 |
| 2022 | $813 | $24,696 | $1,692 | $23,004 |
| 2021 | $718 | $20,376 | $1,692 | $18,684 |
| 2020 | $718 | $20,376 | $1,692 | $18,684 |
| 2019 | $719 | $20,376 | $1,692 | $18,684 |
| 2018 | $720 | $20,376 | $1,692 | $18,684 |
| 2017 | $720 | $20,376 | $1,692 | $18,684 |
| 2016 | $721 | $20,376 | $1,692 | $18,684 |
| 2015 | $722 | $20,376 | $1,692 | $18,684 |
| 2014 | $723 | $20,376 | $1,692 | $18,684 |
| 2013 | -- | $20,375 | $1,691 | $18,684 |
Source: Public Records
Map
Nearby Homes
- 103 N College St
- 284 Barrett Rd
- 105 Orchard Cir
- 134 Brandy Ct
- 2603 Dianne St
- 2302 Thomas St
- 2503 Dianne St
- 0 Barneyville Rd
- 1402 Bear Creek Rd
- 1306 Bear Creek Rd
- 120 Westover Dr
- 123 Westover Dr
- 137 Hood Dr
- 701 Gloria St
- 4711 Highway 37
- 315 Newton Dr
- 625 Coxstill Rd
- 1377 Hutchinson Parrish Rd
- 304 E 3rd St
- 418 E 3rd St
- 603 Sycamore Dr
- 605 Sycamore Dr
- 601 Sycamore Dr
- 602 Bethany St
- 604 Bethany St
- 600 Bethany St
- 602 Sycamore Dr
- 604 Sycamore Dr
- 600 Sycamore Dr
- 607 Sycamore Dr
- 606 Bethany St
- 606 Sycamore Dr
- 603 Crestview Dr
- 603 Bethany St
- 601 Keystone Dr
- 605 Bethany St
- 605 Crestview Dr
- 601 Bethany St
- 609 Sycamore Dr
- 607 Bethany St