Estimated Value: $205,508 - $229,000
--
Bed
--
Bath
1,227
Sq Ft
$180/Sq Ft
Est. Value
About This Home
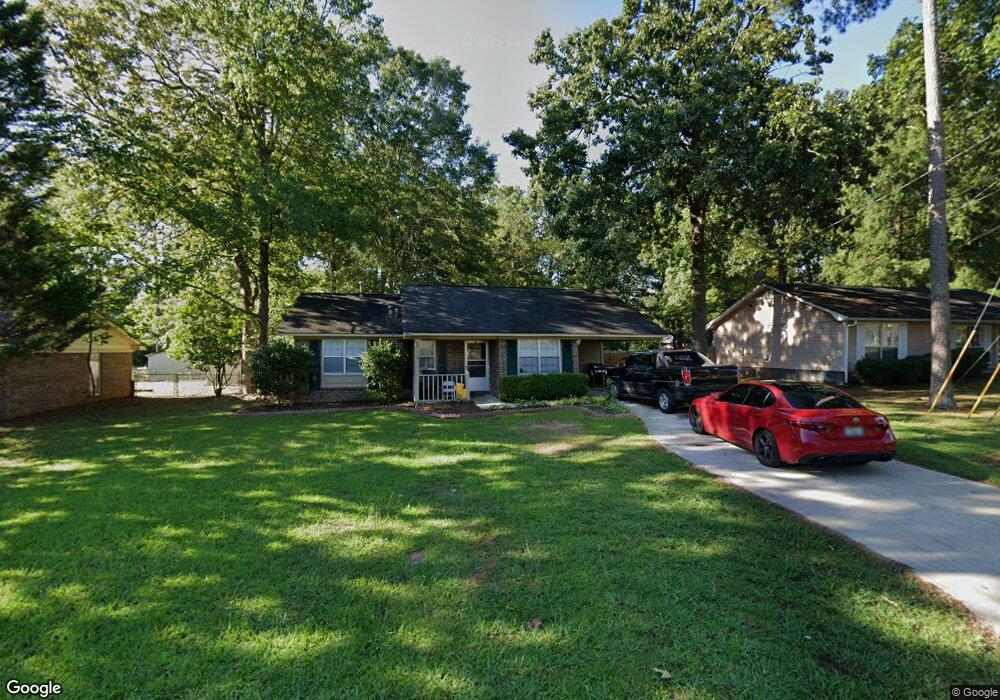
This home is located at 603 Trove Dr NW, Rome, GA 30165 and is currently estimated at $220,377, approximately $179 per square foot. 603 Trove Dr NW is a home located in Floyd County with nearby schools including Rome High School.
Ownership History
Date
Name
Owned For
Owner Type
Purchase Details
Closed on
May 13, 2022
Sold by
Fincham Jennifer
Bought by
Pineda Onefre and Pineda Bolivar
Current Estimated Value
Home Financials for this Owner
Home Financials are based on the most recent Mortgage that was taken out on this home.
Original Mortgage
$124,000
Outstanding Balance
$117,162
Interest Rate
4.67%
Mortgage Type
New Conventional
Estimated Equity
$103,215
Purchase Details
Closed on
Nov 4, 2008
Sold by
Guay Aaron Paul
Bought by
Guay Jennifer Fincham
Purchase Details
Closed on
Apr 29, 2008
Sold by
Not Provided
Bought by
Guay Jennifer Fincham
Home Financials for this Owner
Home Financials are based on the most recent Mortgage that was taken out on this home.
Original Mortgage
$104,975
Interest Rate
5.86%
Mortgage Type
FHA
Purchase Details
Closed on
Jul 16, 2004
Sold by
Dorling William A and Dorling Pansy C
Bought by
Shedd Randy L
Purchase Details
Closed on
Sep 25, 1987
Bought by
Dorling William A and Dorling Pansy C
Create a Home Valuation Report for This Property
The Home Valuation Report is an in-depth analysis detailing your home's value as well as a comparison with similar homes in the area
Home Values in the Area
Average Home Value in this Area
Purchase History
| Date | Buyer | Sale Price | Title Company |
|---|---|---|---|
| Pineda Onefre | $155,000 | -- | |
| Guay Jennifer Fincham | -- | -- | |
| Guay Jennifer Fincham | $110,500 | -- | |
| Guay Aaron | $110,500 | -- | |
| Shedd Randy L | $95,800 | -- | |
| Dorling William A | $56,000 | -- |
Source: Public Records
Mortgage History
| Date | Status | Borrower | Loan Amount |
|---|---|---|---|
| Open | Pineda Onefre | $124,000 | |
| Previous Owner | Guay Aaron | $104,975 |
Source: Public Records
Tax History Compared to Growth
Tax History
| Year | Tax Paid | Tax Assessment Tax Assessment Total Assessment is a certain percentage of the fair market value that is determined by local assessors to be the total taxable value of land and additions on the property. | Land | Improvement |
|---|---|---|---|---|
| 2024 | $2,788 | $72,851 | $6,732 | $66,119 |
| 2023 | $2,580 | $70,394 | $6,120 | $64,274 |
| 2022 | $1,909 | $63,424 | $4,896 | $58,528 |
| 2021 | $1,752 | $54,825 | $4,896 | $49,929 |
| 2020 | $1,705 | $51,397 | $3,672 | $47,725 |
| 2019 | $1,651 | $49,122 | $3,672 | $45,450 |
| 2018 | $1,464 | $40,835 | $3,672 | $37,163 |
| 2017 | $1,426 | $39,786 | $3,672 | $36,114 |
| 2016 | $1,405 | $39,132 | $3,640 | $35,492 |
| 2015 | -- | $39,532 | $3,640 | $35,892 |
| 2014 | -- | $40,422 | $3,640 | $36,782 |
Source: Public Records
Map
Nearby Homes
- 11 Pinestream Dr NW
- 2 Eugenia Cir NW
- 33 NW Hunters Glenn Rd
- 11 Simpson Dr NW
- 104 Sagewood Dr NW
- 25 Shoreline Dr NW
- 8 N Haven Dr
- 8 Ridge Haven Dr NW
- 7 N Haven Dr
- 123 Trentwood Place NW
- 9 N Haven Dr
- 38 Boulder Dr NW
- 3013 Garden Lakes Blvd NW
- 32 Donley Dr NW
- 320 Elliott Dr NW
- 2614 Garden Lakes Blvd NW
- 216 Huffaker Rd NW
- 8 Tall Pines Terrace NW
- 2602 Lakeridge Cir NW
- 605 Trove Dr NW
- 601 Trove Dr NW
- 607 Trove Dr NW
- 610 Elliott Dr NW
- 612 Elliott Dr NW
- 608 Elliott Dr NW
- 602 Trove Dr NW
- 604 Trove Dr NW
- 614 Elliott Dr NW
- 609 Trove Dr NW
- 599 Trove Dr NW
- 600 Trove Dr NW
- 606 Trove Dr NW
- 598 Trove Dr NW
- 604 Elliott Dr NW
- 608 Trove Dr NW
- 616 Elliott Dr NW
- 597 Trove Dr NW
- 596 Trove Dr NW
- 15 Frances Dr NW