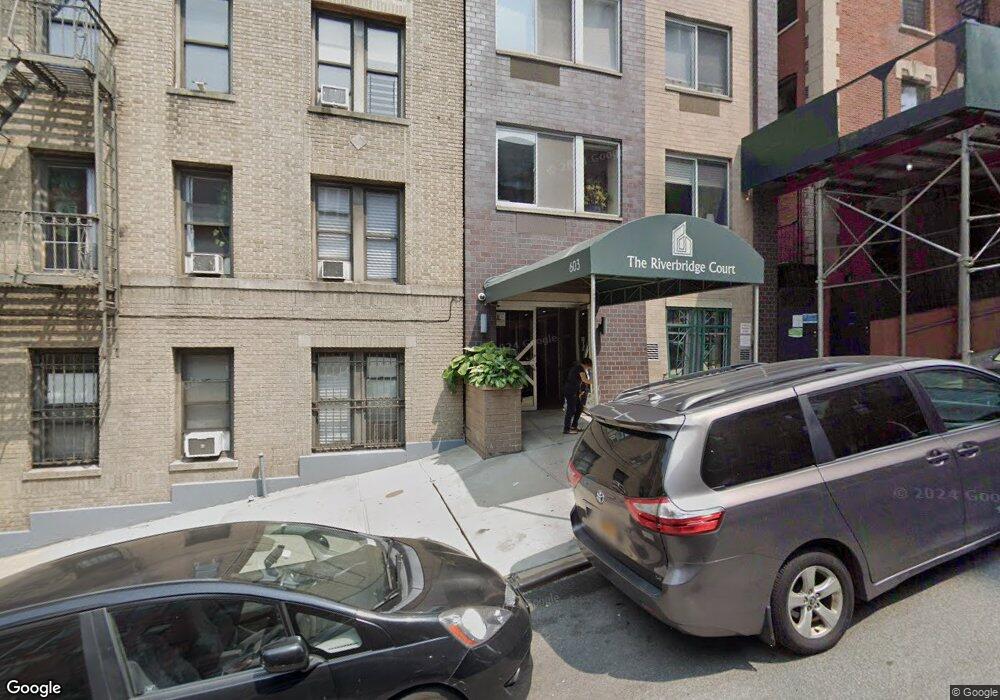
603 W 148th St Unit 9C New York, NY 10031
Hamilton Heights NeighborhoodEstimated Value: $798,000 - $1,071,799
--
Bed
--
Bath
1,461
Sq Ft
$627/Sq Ft
Est. Value
About This Home
This home is located at 603 W 148th St Unit 9C, New York, NY 10031 and is currently estimated at $916,200, approximately $627 per square foot. 603 W 148th St Unit 9C is a home located in New York County with nearby schools including P.S.153 Adam Clayton Powell Jr. Elementary School, New Heights Academy Charter School, and Our Lady of Lourdes School.
Ownership History
Date
Name
Owned For
Owner Type
Purchase Details
Closed on
Dec 15, 2011
Sold by
Cohen Dalya
Bought by
Stuber Andreas
Current Estimated Value
Purchase Details
Closed on
Dec 4, 2008
Sold by
Cohen Dalya and Cohen Michael M
Bought by
Cohen Dalya
Purchase Details
Closed on
Jan 23, 2008
Sold by
Einhorn Edward
Bought by
Cohen Dalya and Cohen Michael M
Home Financials for this Owner
Home Financials are based on the most recent Mortgage that was taken out on this home.
Original Mortgage
$400,000
Interest Rate
6.2%
Mortgage Type
Purchase Money Mortgage
Purchase Details
Closed on
Jul 30, 2007
Sold by
610 West Realty Llc
Bought by
Einhorn Edward
Home Financials for this Owner
Home Financials are based on the most recent Mortgage that was taken out on this home.
Original Mortgage
$71,500
Interest Rate
6.72%
Create a Home Valuation Report for This Property
The Home Valuation Report is an in-depth analysis detailing your home's value as well as a comparison with similar homes in the area
Home Values in the Area
Average Home Value in this Area
Purchase History
| Date | Buyer | Sale Price | Title Company |
|---|---|---|---|
| Stuber Andreas | $539,000 | -- | |
| Stuber Andreas | $539,000 | -- | |
| Cohen Dalya | -- | -- | |
| Cohen Dalya | -- | -- | |
| Cohen Dalya | $779,000 | -- | |
| Cohen Dalya | $779,000 | -- | |
| Einhorn Edward | $715,875 | -- | |
| Einhorn Edward | $715,875 | -- |
Source: Public Records
Mortgage History
| Date | Status | Borrower | Loan Amount |
|---|---|---|---|
| Previous Owner | Cohen Dalya | $400,000 | |
| Previous Owner | Einhorn Edward | $71,500 | |
| Previous Owner | Einhorn Edward | $572,700 |
Source: Public Records
Tax History Compared to Growth
Tax History
| Year | Tax Paid | Tax Assessment Tax Assessment Total Assessment is a certain percentage of the fair market value that is determined by local assessors to be the total taxable value of land and additions on the property. | Land | Improvement |
|---|---|---|---|---|
| 2025 | $228 | $116,949 | $3,385 | $113,564 |
| 2024 | $228 | $102,275 | $3,385 | $98,890 |
| 2023 | $224 | $95,468 | $3,385 | $92,083 |
| 2022 | $223 | $95,779 | $3,385 | $92,394 |
| 2021 | $224 | $85,386 | $3,385 | $82,001 |
| 2020 | $227 | $97,536 | $3,385 | $94,151 |
| 2019 | $228 | $98,798 | $3,385 | $95,413 |
| 2018 | $232 | $88,451 | $3,385 | $85,066 |
| 2017 | $232 | $80,126 | $3,386 | $76,740 |
| 2016 | $235 | $69,797 | $3,386 | $66,411 |
| 2015 | $184 | $69,641 | $3,385 | $66,256 |
| 2014 | $184 | $67,683 | $3,385 | $64,298 |
Source: Public Records
Map
Nearby Homes
- 603 W 148th St Unit 5D
- 603 W 148th St Unit 3
- 725 Riverside Dr Unit 11A
- 555 W 149th St Unit 3
- 558 W 150th St Unit 101
- 700 Riverside Dr Unit 5D
- 547 W 147th St Unit A1
- 626 W 147th St
- 594 W 152nd St
- 525 W 150th St
- 518 W 149th St
- 690 Riverside Dr Unit 6D
- 690 Riverside Dr Unit 1C
- 510 W 150th St Unit 5
- 3692 Broadway Unit 24
- 515 W 151st St Unit 4W
- 750 Riverside Dr Unit 4E
- 529 W 152nd St Unit 2
- 506 W 145th St Unit 4 D
- 408 Convent Ave
- 603 W 148th St Unit 6
- 603 W 148th St Unit 5
- 603 W 148th St Unit 4
- 603 W 148th St Unit 2
- 603 W 148th St Unit 11C
- 603 W 148th St Unit 11B
- 603 W 148th St Unit 11A
- 603 W 148th St Unit 10C
- 603 W 148th St Unit 10B
- 603 W 148th St Unit 10A
- 603 W 148th St Unit 9B
- 603 W 148th St Unit 9A
- 603 W 148th St Unit 8D
- 603 W 148th St Unit 8C
- 603 W 148th St Unit 8B
- 603 W 148th St Unit 8A
- 603 W 148th St Unit 7D
- 603 W 148th St Unit 7C
- 603 W 148th St Unit 7B
- 603 W 148th St Unit 7A