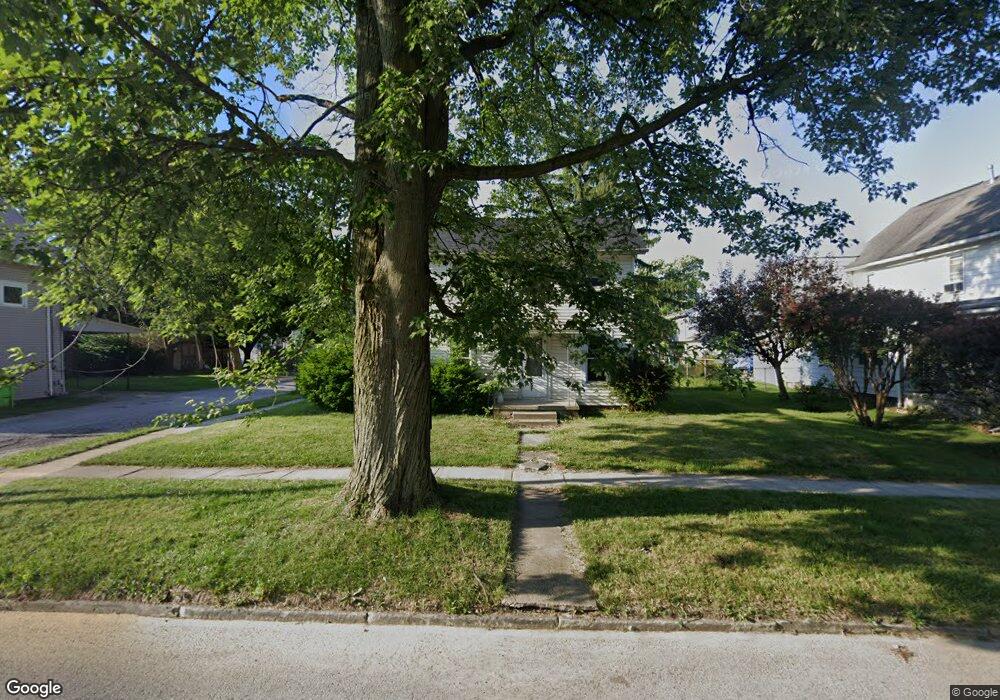
603 W Fremont St Fostoria, OH 44830
Estimated Value: $20,587 - $111,000
2
Beds
1
Bath
1,245
Sq Ft
$66/Sq Ft
Est. Value
About This Home
This home is located at 603 W Fremont St, Fostoria, OH 44830 and is currently estimated at $81,647, approximately $65 per square foot. 603 W Fremont St is a home located in Hancock County with nearby schools including Fostoria Intermediate Elementary School and Fostoria Junior/Senior High School.
Ownership History
Date
Name
Owned For
Owner Type
Purchase Details
Closed on
Aug 1, 2019
Sold by
Marker Edward J
Bought by
Newera Propertu Solutions Llc
Current Estimated Value
Purchase Details
Closed on
Jun 9, 2010
Sold by
Runion Timothy M and Runion Celena M
Bought by
Marker Edward J
Purchase Details
Closed on
May 25, 2010
Sold by
Welch Ronald L and Welch Claire
Bought by
Runion Timothy M
Create a Home Valuation Report for This Property
The Home Valuation Report is an in-depth analysis detailing your home's value as well as a comparison with similar homes in the area
Home Values in the Area
Average Home Value in this Area
Purchase History
| Date | Buyer | Sale Price | Title Company |
|---|---|---|---|
| Newera Propertu Solutions Llc | $12,000 | Assured Title Agcy Of Tiffin | |
| Marker Edward J | $13,000 | None Available | |
| Runion Timothy M | $12,000 | Legacy Title Llc |
Source: Public Records
Tax History Compared to Growth
Tax History
| Year | Tax Paid | Tax Assessment Tax Assessment Total Assessment is a certain percentage of the fair market value that is determined by local assessors to be the total taxable value of land and additions on the property. | Land | Improvement |
|---|---|---|---|---|
| 2024 | $1,168 | $22,940 | $3,840 | $19,100 |
| 2023 | $1,165 | $22,940 | $3,840 | $19,100 |
| 2022 | $1,361 | $22,940 | $3,840 | $19,100 |
| 2021 | $1,046 | $18,190 | $4,030 | $14,160 |
| 2020 | $1,051 | $18,190 | $4,030 | $14,160 |
| 2019 | $1,046 | $18,190 | $4,030 | $14,160 |
| 2018 | $1,008 | $15,890 | $3,510 | $12,380 |
| 2017 | $458 | $15,890 | $3,510 | $12,380 |
| 2016 | $1,668 | $15,890 | $3,510 | $12,380 |
| 2015 | $661 | $11,290 | $2,960 | $8,330 |
| 2014 | $569 | $11,290 | $2,960 | $8,330 |
| 2012 | $666 | $13,130 | $2,960 | $10,170 |
Source: Public Records
Map
Nearby Homes
- 509 College Ave
- 603 N Vine St
- 203 N Union St
- 520 N Union St
- 348 W South St
- 351 W South St
- 723 N Union St
- 211 Summit St
- 0 W South Route 12
- 931 N Union St
- 892 N Countyline St
- 435 Park Ave
- 900 N Countyline St
- 901 Central Ave
- 633 Maple St
- 540 N Poplar St
- 321 Mcdougal St
- 411 Monticello Dr
- 418 W Ridge Dr
- 207 W Culbertson St
- 609 W Fremont St
- 565 W Fremont St
- 326 N Grant St
- 325 N Grant St
- 555 W Fremont St
- 615 W Fremont St
- 623 W Fremont St
- 324 N Grant St
- 617 W Fremont St
- 551 W Fremont St
- 320 N Grant St
- 600 W Fremont St
- 549 W Fremont St
- 606 W Fremont St
- 502 College Ave
- 508 College Ave
- 614 W Fremont St
- 558 W Fremont St
- 558 W Fremont St
- 631 W Fremont St