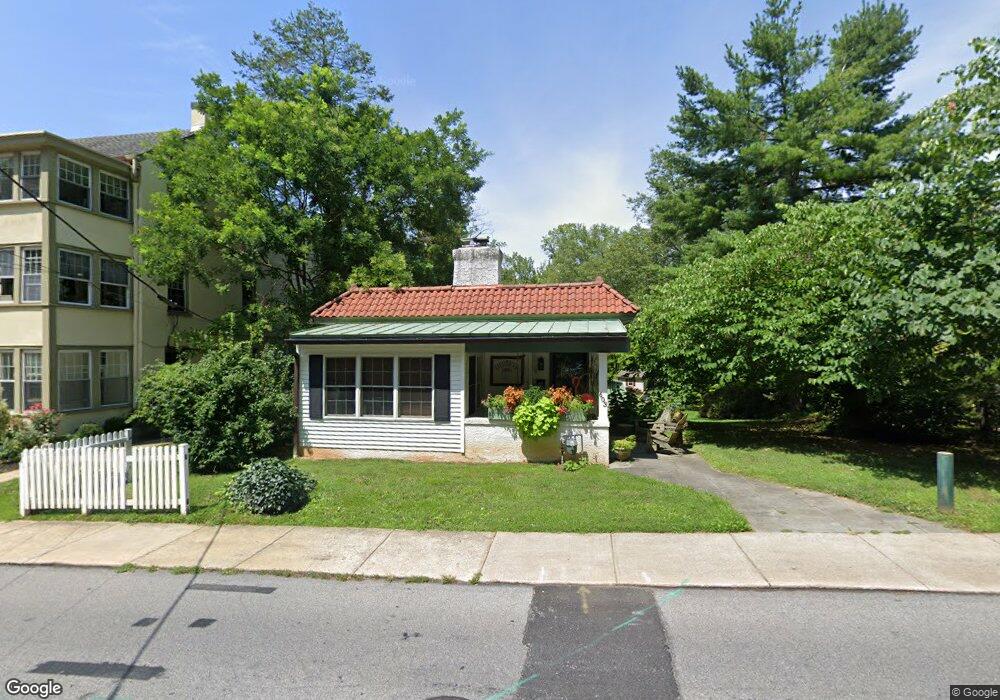
603 W Miner St West Chester, PA 19382
Estimated Value: $371,000 - $606,000
2
Beds
1
Bath
888
Sq Ft
$507/Sq Ft
Est. Value
About This Home
This home is located at 603 W Miner St, West Chester, PA 19382 and is currently estimated at $450,231, approximately $507 per square foot. 603 W Miner St is a home located in Chester County with nearby schools including Hillsdale Elementary School, Stetson Middle School, and Bayard Rustin High School.
Ownership History
Date
Name
Owned For
Owner Type
Purchase Details
Closed on
Jul 1, 2015
Sold by
Drury John A
Bought by
Cummings Jill
Current Estimated Value
Home Financials for this Owner
Home Financials are based on the most recent Mortgage that was taken out on this home.
Original Mortgage
$185,600
Outstanding Balance
$144,821
Interest Rate
3.88%
Mortgage Type
New Conventional
Estimated Equity
$305,410
Purchase Details
Closed on
Dec 22, 2008
Sold by
Drury John A and Cummings Jill S
Bought by
Drury John A
Purchase Details
Closed on
Jun 1, 2005
Sold by
Patten Christopher P and Patten Alison J
Bought by
Drury John A and Cummings Jill S
Home Financials for this Owner
Home Financials are based on the most recent Mortgage that was taken out on this home.
Original Mortgage
$247,200
Interest Rate
5.83%
Mortgage Type
Fannie Mae Freddie Mac
Purchase Details
Closed on
Jan 2, 2001
Sold by
Patten Alison J
Bought by
Patten Christopher P and Patten Alison J
Create a Home Valuation Report for This Property
The Home Valuation Report is an in-depth analysis detailing your home's value as well as a comparison with similar homes in the area
Home Values in the Area
Average Home Value in this Area
Purchase History
| Date | Buyer | Sale Price | Title Company |
|---|---|---|---|
| Cummings Jill | -- | None Available | |
| Drury John A | $88,722 | None Available | |
| Drury John A | $309,000 | -- | |
| Patten Christopher P | -- | -- |
Source: Public Records
Mortgage History
| Date | Status | Borrower | Loan Amount |
|---|---|---|---|
| Open | Cummings Jill | $185,600 | |
| Previous Owner | Drury John A | $247,200 |
Source: Public Records
Tax History Compared to Growth
Tax History
| Year | Tax Paid | Tax Assessment Tax Assessment Total Assessment is a certain percentage of the fair market value that is determined by local assessors to be the total taxable value of land and additions on the property. | Land | Improvement |
|---|---|---|---|---|
| 2025 | $3,225 | $91,940 | $37,370 | $54,570 |
| 2024 | $3,225 | $91,940 | $37,370 | $54,570 |
| 2023 | $3,189 | $91,940 | $37,370 | $54,570 |
| 2022 | $3,155 | $91,940 | $37,370 | $54,570 |
| 2021 | $3,090 | $91,940 | $37,370 | $54,570 |
| 2020 | $3,033 | $91,940 | $37,370 | $54,570 |
| 2019 | $2,997 | $91,940 | $37,370 | $54,570 |
| 2018 | $2,943 | $91,940 | $37,370 | $54,570 |
| 2017 | $2,889 | $91,940 | $37,370 | $54,570 |
| 2016 | $2,053 | $91,940 | $37,370 | $54,570 |
| 2015 | $2,053 | $91,940 | $37,370 | $54,570 |
| 2014 | $2,053 | $91,940 | $37,370 | $54,570 |
Source: Public Records
Map
Nearby Homes
- 525 Raymond Dr Unit 45
- 523 Raymond Dr Unit 46
- 401 W Barnard St
- 616 W Chestnut St
- 443 W Gay St
- 418 Hannum Ave
- 19 S New St
- 333 Hannum Ave
- 228 Dean St
- 345 Star Tavern Ln
- 724 W Nields St
- 303 Star Tavern Ln
- 303 W Washington St
- 164 Mansion House Dr Unit 401A
- 408 S Church St
- 116 Price St
- 505 S Maryland Ave
- 110 S High St
- 737 Bradford Terrace Unit 252
- 765 Bradford Terrace Unit 238
- 605 W Miner St Unit 3W
- 605 W Miner St Unit 1E
- 605 W Miner St Unit 2W
- 605 W Miner St Unit 1W
- 605 W Miner St
- 601 W Miner St
- 14 S Everhart Ave
- 607 W Miner St
- 609 W Miner St
- 12 S Everhart Ave
- 519 W Miner St
- 17 S Everhart Ave
- 611 W Miner St
- 13 S Bradford Ave
- 613 W Miner St
- 8 S Everhart Ave
- 517 W Miner St
- 11 S Bradford Ave
- 615 W Miner St
- 15 S Everhart Ave