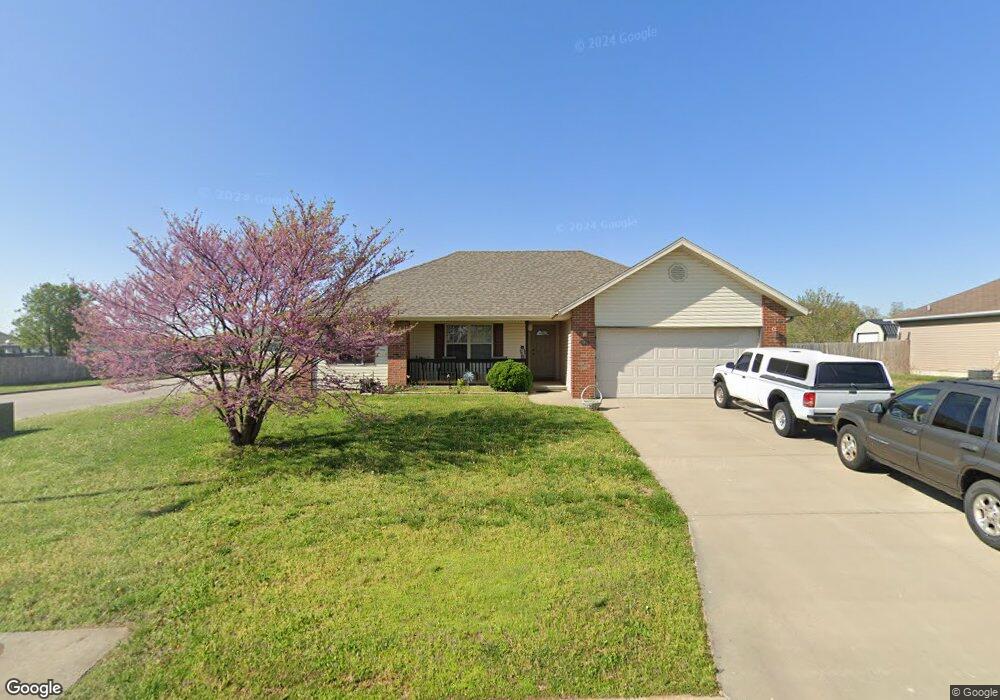
603 W Osage St Clever, MO 65631
Estimated Value: $225,000 - $238,000
3
Beds
1
Bath
1,312
Sq Ft
$177/Sq Ft
Est. Value
About This Home
This home is located at 603 W Osage St, Clever, MO 65631 and is currently estimated at $232,150, approximately $176 per square foot. 603 W Osage St is a home with nearby schools including Clever High School.
Ownership History
Date
Name
Owned For
Owner Type
Purchase Details
Closed on
Oct 11, 2024
Sold by
Lnw Investments Llc
Bought by
Cobb Kory and Patterson Rachel
Current Estimated Value
Home Financials for this Owner
Home Financials are based on the most recent Mortgage that was taken out on this home.
Original Mortgage
$225,834
Outstanding Balance
$222,347
Interest Rate
6.35%
Mortgage Type
FHA
Estimated Equity
$9,803
Purchase Details
Closed on
Jan 31, 2022
Sold by
Triple M Rentals Llc
Bought by
Lnw Investments Llc
Purchase Details
Closed on
Jun 23, 2016
Sold by
Fausett Earnest and Fausett Laquetta
Bought by
Mgm Properties Inc
Purchase Details
Closed on
Apr 11, 2008
Sold by
Mgm Properties Inc
Bought by
Fausett Earnest and Fausett Laquetta
Purchase Details
Closed on
Aug 3, 2007
Sold by
Briars Development Llc
Bought by
Mgm Properties Inc
Home Financials for this Owner
Home Financials are based on the most recent Mortgage that was taken out on this home.
Original Mortgage
$94,350
Interest Rate
6.64%
Mortgage Type
Construction
Create a Home Valuation Report for This Property
The Home Valuation Report is an in-depth analysis detailing your home's value as well as a comparison with similar homes in the area
Home Values in the Area
Average Home Value in this Area
Purchase History
| Date | Buyer | Sale Price | Title Company |
|---|---|---|---|
| Cobb Kory | -- | Great American Title | |
| Lnw Investments Llc | -- | None Listed On Document | |
| Mgm Properties Inc | -- | Great American Title | |
| Fausett Earnest | $106,900 | None Available | |
| Mgm Properties Inc | -- | None Available |
Source: Public Records
Mortgage History
| Date | Status | Borrower | Loan Amount |
|---|---|---|---|
| Open | Cobb Kory | $225,834 | |
| Previous Owner | Mgm Properties Inc | $94,350 | |
| Closed | Fausett Earnest | $0 |
Source: Public Records
Tax History Compared to Growth
Tax History
| Year | Tax Paid | Tax Assessment Tax Assessment Total Assessment is a certain percentage of the fair market value that is determined by local assessors to be the total taxable value of land and additions on the property. | Land | Improvement |
|---|---|---|---|---|
| 2024 | $1,580 | $23,500 | -- | -- |
| 2023 | $1,580 | $23,500 | $0 | $0 |
| 2022 | $1,436 | $21,220 | $0 | $0 |
| 2021 | $1,433 | $21,220 | $0 | $0 |
| 2020 | $1,330 | $19,440 | $0 | $0 |
| 2019 | $1,330 | $19,440 | $0 | $0 |
| 2018 | $1,144 | $16,740 | $0 | $0 |
| 2017 | $1,144 | $16,740 | $0 | $0 |
| 2016 | $1,128 | $16,740 | $0 | $0 |
| 2015 | $1,129 | $16,740 | $16,740 | $0 |
| 2014 | $1,092 | $16,700 | $0 | $0 |
| 2013 | $11 | $16,700 | $0 | $0 |
| 2011 | $11 | $36,140 | $0 | $0 |
Source: Public Records
Map
Nearby Homes
- 7830 Snowdrop Ave
- 205 Ashton Ave
- 406 W Cherokee Path
- 201 N Christopher Ln
- 214 Forgey Rd
- 111 Ashton Ave
- 108 Ashton Ave
- 418 Forgey Rd
- 407 W Brown St
- 000 N Public Ave
- 000 State Highway P
- 104 E Meadowbrook Ave
- 235 Sandy Forest Ln
- 127 E Teakwood Ave
- 123 E Teakwood Ave
- 504 Wampler Dr
- 118 Evergreen Cir
- 312 E Grant St
- 412 Westview
- 596 Clever Heights