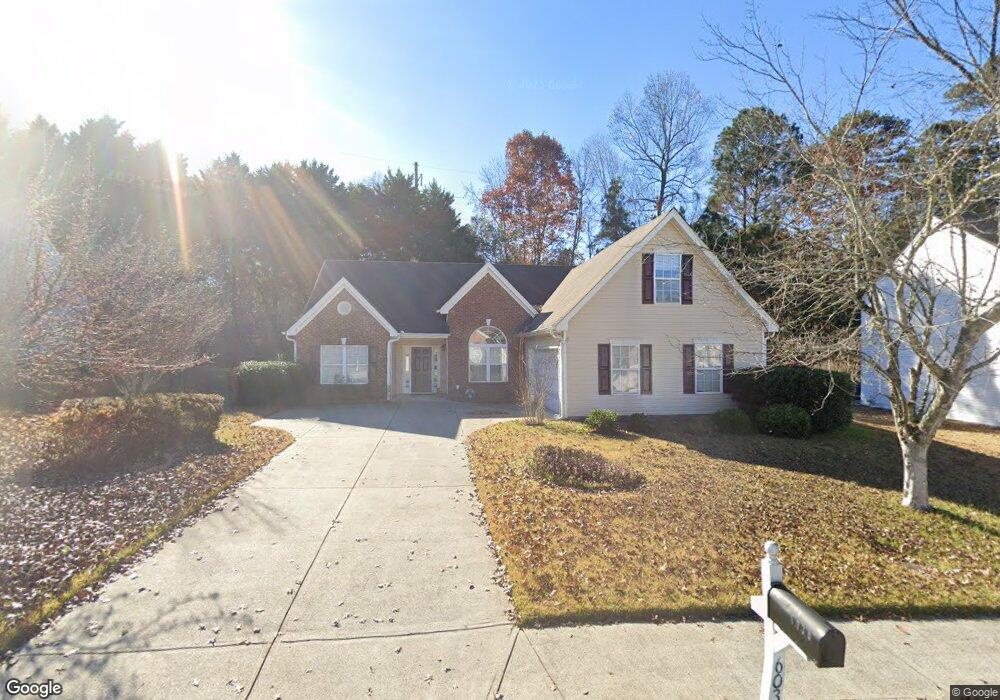
6030 Ambercrest Ct Buford, GA 30518
Estimated Value: $348,000 - $385,000
3
Beds
2
Baths
1,784
Sq Ft
$203/Sq Ft
Est. Value
About This Home
This home is located at 6030 Ambercrest Ct, Buford, GA 30518 and is currently estimated at $362,477, approximately $203 per square foot. 6030 Ambercrest Ct is a home located in Gwinnett County with nearby schools including White Oak Elementary School, Lanier Middle School, and Lanier High School.
Ownership History
Date
Name
Owned For
Owner Type
Purchase Details
Closed on
Sep 6, 2011
Sold by
Federal National Mortgage Association
Bought by
Lee Ingue
Current Estimated Value
Home Financials for this Owner
Home Financials are based on the most recent Mortgage that was taken out on this home.
Original Mortgage
$7,500
Outstanding Balance
$5,128
Interest Rate
4.38%
Mortgage Type
New Conventional
Estimated Equity
$357,349
Purchase Details
Closed on
Sep 7, 2010
Sold by
Citimortgage Inc
Bought by
Federal Natl Mtg Assn Fnma
Purchase Details
Closed on
Nov 20, 2003
Sold by
Chico Charles D and Chico Jennifer L
Bought by
Grimes David
Purchase Details
Closed on
Sep 12, 2003
Sold by
Eric Chafin Hm Builders Inc
Bought by
Chico Charles D and Chico Jennifer
Home Financials for this Owner
Home Financials are based on the most recent Mortgage that was taken out on this home.
Original Mortgage
$138,000
Interest Rate
6.28%
Mortgage Type
New Conventional
Create a Home Valuation Report for This Property
The Home Valuation Report is an in-depth analysis detailing your home's value as well as a comparison with similar homes in the area
Home Values in the Area
Average Home Value in this Area
Purchase History
| Date | Buyer | Sale Price | Title Company |
|---|---|---|---|
| Lee Ingue | $91,900 | -- | |
| Federal Natl Mtg Assn Fnma | -- | -- | |
| Citimortgage Inc | $102,747 | -- | |
| Grimes David | -- | -- | |
| Chico Charles D | $154,000 | -- |
Source: Public Records
Mortgage History
| Date | Status | Borrower | Loan Amount |
|---|---|---|---|
| Open | Lee Ingue | $7,500 | |
| Open | Lee Ingue | $83,537 | |
| Previous Owner | Chico Charles D | $138,000 |
Source: Public Records
Tax History Compared to Growth
Tax History
| Year | Tax Paid | Tax Assessment Tax Assessment Total Assessment is a certain percentage of the fair market value that is determined by local assessors to be the total taxable value of land and additions on the property. | Land | Improvement |
|---|---|---|---|---|
| 2025 | $3,861 | $146,520 | $40,000 | $106,520 |
| 2024 | $3,146 | $105,280 | $22,000 | $83,280 |
| 2023 | $3,146 | $105,280 | $22,000 | $83,280 |
| 2022 | $3,106 | $105,280 | $22,000 | $83,280 |
| 2021 | $2,653 | $81,760 | $17,200 | $64,560 |
| 2020 | $2,671 | $81,760 | $17,200 | $64,560 |
| 2019 | $2,604 | $81,760 | $17,200 | $64,560 |
| 2018 | $2,379 | $71,400 | $13,000 | $58,400 |
| 2016 | $2,227 | $63,320 | $13,000 | $50,320 |
| 2015 | $2,156 | $59,280 | $13,000 | $46,280 |
| 2014 | $2,004 | $52,320 | $13,000 | $39,320 |
Source: Public Records
Map
Nearby Homes
- 6205 Ambercrest Ct
- 1930 Marina Way
- 6054 Stewart Rd
- 1585 Jimmy Dodd Rd
- 2015 Buford Dam Rd
- 2030 Buford Dam Rd
- 1549 Stewart Ridge Dr
- 1530 Stewart Ridge Dr
- 6351 Stewart Ridge Walk
- 6220 Stewart Rd
- 6049 Cove Park Dr
- 5774 Harbor Dr
- 1729 Rowland Pass
- 818 Dodd Trail Unit 171
- 2075 Pine Tree Dr Unit B2
- 2075 Pine Tree Dr Unit A3
- 5820 Elm Tree Dr Unit 1
- 1983 Anchor Way Unit 1
- 6255 Lakeview Dr
- 1403 Sparkling Cove Dr
- 6020 Ambercrest Ct
- 6040 Ambercrest Ct
- 6010 Ambercrest Ct
- 6050 Ambercrest Ct
- 6035 Ambercrest Ct
- 6045 Ambercrest Ct
- 6015 Ambercrest Ct
- 6000 Ambercrest Ct
- 6060 Ambercrest Ct
- 6005 Ambercrest Ct
- 6065 Ambercrest Ct
- 6014 Kincorth Cir
- 6070 Ambercrest Ct
- 6034 Kincorth Cir
- 6085 Ambercrest Ct
- 6088 Ambercrest Ct
- 1771 Jimmy Dodd Rd
- 1765 Jimmy Dodd Rd
- 6004 Kincorth Cir
- 1715 Ambercrest Place