
Seller's Agent in 2012
Allen Culpepper
Priority Realty Group
(317) 614-7722
5 in this area
50 Total Sales
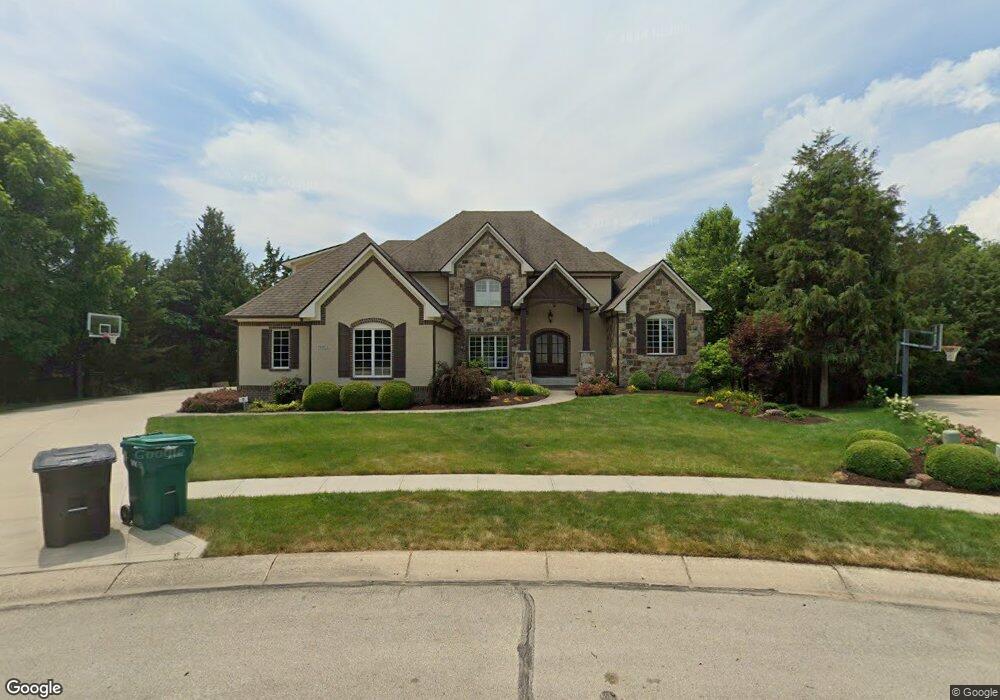
Estimated Value: $702,000 - $937,612
LISTED & PENDED
Last Agent to Sell the Property
Priority Realty Group License #RB14037770 Listed on: 03/14/2012
| Date | Buyer | Sale Price | Title Company |
|---|---|---|---|
| Farman David B | -- | None Available | |
| Alsup James R | -- | None Available |
| Date | Status | Borrower | Loan Amount |
|---|---|---|---|
| Closed | Farman David B | $90,000 |
| Date | Event | Price | List to Sale | Price per Sq Ft |
|---|---|---|---|---|
| 04/17/2012 04/17/12 | Sold | $120,000 | -25.0% | -- |
| 03/12/2012 03/12/12 | Pending | -- | -- | -- |
| 02/29/2012 02/29/12 | For Sale | $159,900 | -- | -- |
| Year | Tax Paid | Tax Assessment Tax Assessment Total Assessment is a certain percentage of the fair market value that is determined by local assessors to be the total taxable value of land and additions on the property. | Land | Improvement |
|---|---|---|---|---|
| 2024 | $9,427 | $822,400 | $147,600 | $674,800 |
| 2023 | $9,574 | $759,300 | $134,400 | $624,900 |
| 2022 | $9,407 | $743,200 | $129,000 | $614,200 |
| 2021 | $9,487 | $737,700 | $129,000 | $608,700 |
| 2020 | $9,672 | $731,600 | $129,000 | $602,600 |
| 2019 | $7,903 | $631,300 | $121,800 | $509,500 |
| 2018 | $7,163 | $595,200 | $121,800 | $473,400 |
| 2017 | $5,666 | $566,600 | $115,800 | $450,800 |
| 2016 | $5,592 | $549,200 | $115,800 | $433,400 |
| 2014 | $5,370 | $537,000 | $113,300 | $423,700 |
Seller's Agent in 2012
Allen Culpepper
Priority Realty Group
(317) 614-7722
5 in this area
50 Total Sales
Seller Co-Listing Agent in 2012
Jason Alsup
eXp Realty, LLC
(317) 258-1399
21 in this area
205 Total Sales
Source: MIBOR Broker Listing Cooperative®
MLS Number: 21165602
APN: 32-10-22-102-002.000-031
Disclaimer: Certain information contained herein is derived from information provided by parties other than Homes.com. All information provided is deemed reliable, but is not guaranteed to be accurate and should be independently verified.
![]() Based on information submitted to the MLS GRID. All data is obtained from various sources and may not have been verified by broker or MLS GRID. Supplied Open House Information is subject to change without notice. All information should be independently reviewed and verified for accuracy. Properties may or may not be listed by the office/agent presenting the information. Some IDX listings have been excluded from this website.
Based on information submitted to the MLS GRID. All data is obtained from various sources and may not have been verified by broker or MLS GRID. Supplied Open House Information is subject to change without notice. All information should be independently reviewed and verified for accuracy. Properties may or may not be listed by the office/agent presenting the information. Some IDX listings have been excluded from this website.