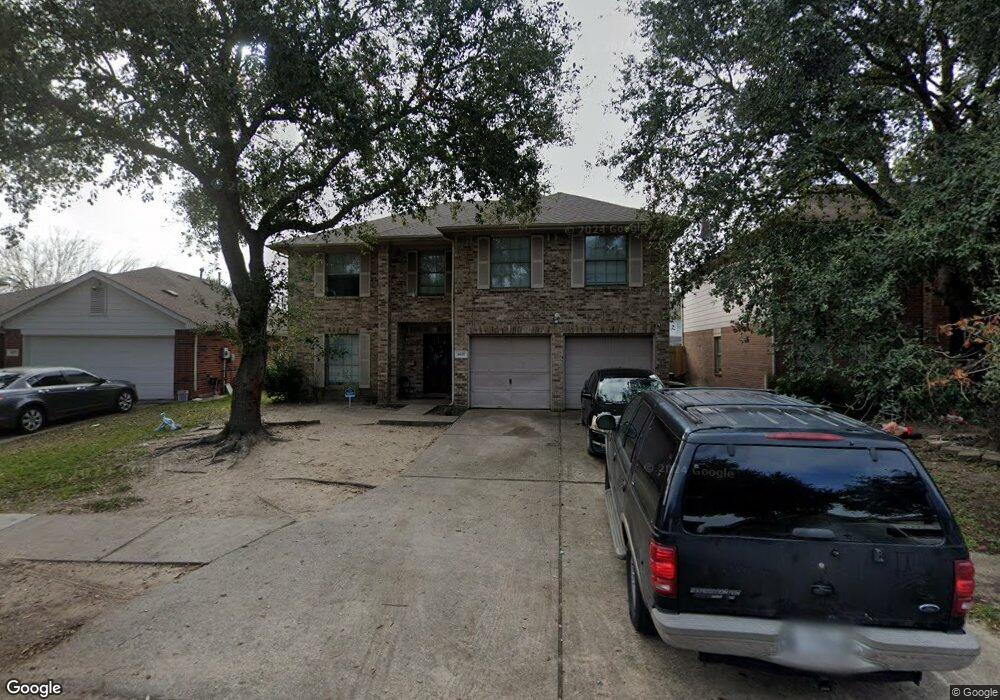
6031 Fallmont Dr Houston, TX 77086
North Houston NeighborhoodEstimated Value: $269,805 - $308,000
5
Beds
3
Baths
2,654
Sq Ft
$108/Sq Ft
Est. Value
About This Home
This home is located at 6031 Fallmont Dr, Houston, TX 77086 and is currently estimated at $287,701, approximately $108 per square foot. 6031 Fallmont Dr is a home located in Harris County with nearby schools including Kujawa EC/Pre-K/K School, Wilson Intermediate School, and Shotwell Middle School.
Ownership History
Date
Name
Owned For
Owner Type
Purchase Details
Closed on
Nov 7, 2014
Sold by
Domingo Junette Sto and Odeh Kingsley A
Bought by
Odeh Kingsley A
Current Estimated Value
Purchase Details
Closed on
Mar 15, 2013
Sold by
Domingo Junette Sto
Bought by
Domingo Junette Sto and Odeh Kingsley A
Purchase Details
Closed on
Mar 6, 2013
Sold by
The Secretary Of Hud
Bought by
Domingo Junette Sto
Purchase Details
Closed on
Jun 16, 2012
Sold by
Pnc Bank Na
Bought by
The Secretary Of Hud
Purchase Details
Closed on
Jun 15, 2012
Sold by
Green Charles and Green Ava
Bought by
Pnc Bank National Association
Purchase Details
Closed on
Aug 30, 2002
Sold by
Kb Home Lone Star Lp
Bought by
Green Charles
Home Financials for this Owner
Home Financials are based on the most recent Mortgage that was taken out on this home.
Original Mortgage
$146,501
Interest Rate
6.41%
Mortgage Type
FHA
Create a Home Valuation Report for This Property
The Home Valuation Report is an in-depth analysis detailing your home's value as well as a comparison with similar homes in the area
Home Values in the Area
Average Home Value in this Area
Purchase History
| Date | Buyer | Sale Price | Title Company |
|---|---|---|---|
| Odeh Kingsley A | -- | None Available | |
| Domingo Junette Sto | -- | None Available | |
| Domingo Junette Sto | -- | None Available | |
| The Secretary Of Hud | -- | None Available | |
| Pnc Bank National Association | $176,118 | None Available | |
| Green Charles | -- | First American Title |
Source: Public Records
Mortgage History
| Date | Status | Borrower | Loan Amount |
|---|---|---|---|
| Previous Owner | Green Charles | $146,501 |
Source: Public Records
Tax History Compared to Growth
Tax History
| Year | Tax Paid | Tax Assessment Tax Assessment Total Assessment is a certain percentage of the fair market value that is determined by local assessors to be the total taxable value of land and additions on the property. | Land | Improvement |
|---|---|---|---|---|
| 2025 | $6,161 | $262,268 | $34,414 | $227,854 |
| 2024 | $6,161 | $266,391 | $34,414 | $231,977 |
| 2023 | $6,161 | $274,056 | $35,227 | $238,829 |
| 2022 | $6,003 | $246,600 | $27,098 | $219,502 |
| 2021 | $4,494 | $185,049 | $27,098 | $157,951 |
| 2020 | $4,639 | $171,845 | $27,098 | $144,747 |
| 2019 | $4,901 | $174,606 | $18,968 | $155,638 |
| 2018 | $1,462 | $155,000 | $18,968 | $136,032 |
| 2017 | $4,195 | $155,000 | $18,968 | $136,032 |
| 2016 | $3,818 | $141,076 | $18,968 | $122,108 |
| 2015 | $3,116 | $124,000 | $18,968 | $105,032 |
| 2014 | $3,116 | $114,988 | $18,968 | $96,020 |
Source: Public Records
Map
Nearby Homes
- 5914 Stirring Winds Ln
- 10730 Antoine Dr
- 6411 Halstead Meadows Cir
- 3265 Frick Rd
- 12623 Ann Louise Rd
- 00 Essie Rd
- 6622 Sutton Meadows Dr
- 10214 Trade Winds Dr
- 6706 Redding Springs Ln
- 6606 Dusty Dawn Dr
- 6703 Deer Ridge Ln
- 00 Romona Blvd
- 3127 Frick Rd
- 10306 Jillana Kaye Dr
- 0 Tomball Pkwy
- 6830 Desert Rose Ln
- 13308 Ann Louise Rd
- 6822 Dusty Dawn Dr
- 12610 Twilight Bend Ct
- 7011 Lower Arrow Dr
- 6027 Fallmont Dr
- 6039 Fallmont Dr
- 6023 Fallmont Dr
- 6030 Drenner Park Ln
- 6034 Drenner Park Ln
- 6026 Drenner Park Ln
- 6022 Drenner Park Ln
- 6038 Drenner Park Ln
- 6019 Fallmont Dr
- 6043 Fallmont Dr
- 6018 Drenner Park Ln
- 6026 Fallmont Dr
- 6030 Fallmont Dr
- 6022 Fallmont Dr
- 6042 Drenner Park Ln
- 6034 Fallmont Dr
- 6015 Fallmont Dr
- 6014 Drenner Park Ln
- 6018 Fallmont Dr
- 6038 Fallmont Dr