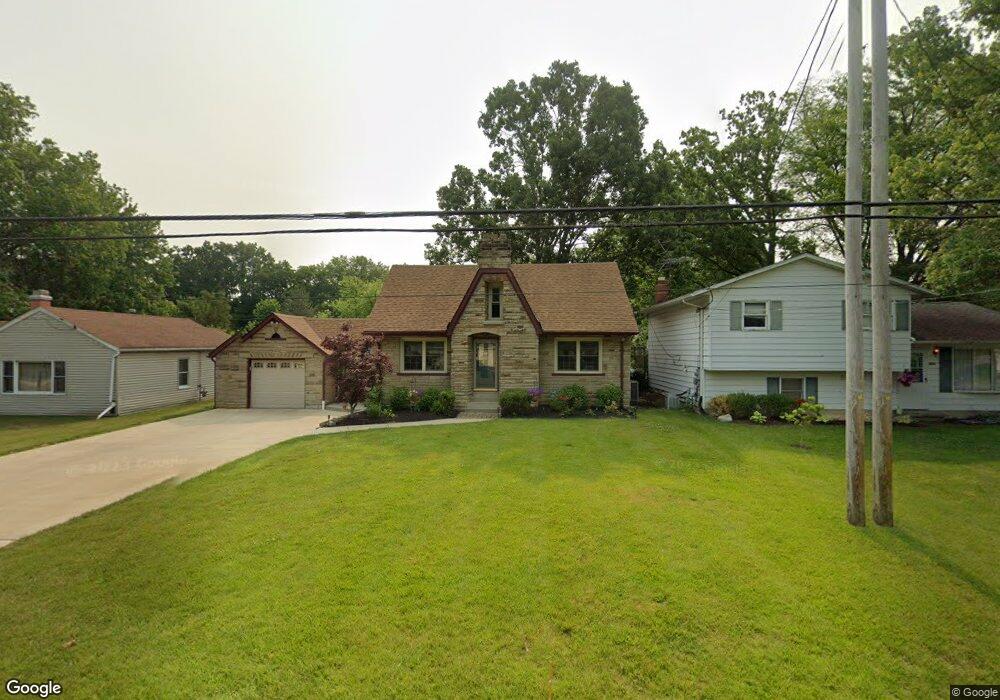
6031 Wallace Blvd North Ridgeville, OH 44039
Estimated Value: $183,000 - $277,000
2
Beds
1
Bath
1,629
Sq Ft
$136/Sq Ft
Est. Value
About This Home
This home is located at 6031 Wallace Blvd, North Ridgeville, OH 44039 and is currently estimated at $222,036, approximately $136 per square foot. 6031 Wallace Blvd is a home located in Lorain County with nearby schools including North Ridgeville Academic Center, Ranger High Tech Academy, and Liberty Elementary School.
Ownership History
Date
Name
Owned For
Owner Type
Purchase Details
Closed on
Sep 20, 2022
Sold by
Snyder Adam and Snyder Lacey A
Bought by
Snyder Lacey A
Current Estimated Value
Home Financials for this Owner
Home Financials are based on the most recent Mortgage that was taken out on this home.
Original Mortgage
$126,500
Outstanding Balance
$121,564
Interest Rate
6.02%
Mortgage Type
New Conventional
Estimated Equity
$100,472
Purchase Details
Closed on
Jul 1, 2017
Sold by
Snyder Lacey A and Snyder Adam
Bought by
Snyder Lacey A and Snyder Adam
Home Financials for this Owner
Home Financials are based on the most recent Mortgage that was taken out on this home.
Original Mortgage
$75,000
Interest Rate
3.95%
Mortgage Type
New Conventional
Purchase Details
Closed on
Apr 18, 2011
Sold by
Household Realty Corporation
Bought by
Murray Lacey A
Home Financials for this Owner
Home Financials are based on the most recent Mortgage that was taken out on this home.
Original Mortgage
$68,225
Interest Rate
4.87%
Mortgage Type
FHA
Purchase Details
Closed on
Dec 11, 2010
Sold by
Foster Jeff and Zajac Belinda
Bought by
Household Realty Corporation
Create a Home Valuation Report for This Property
The Home Valuation Report is an in-depth analysis detailing your home's value as well as a comparison with similar homes in the area
Home Values in the Area
Average Home Value in this Area
Purchase History
| Date | Buyer | Sale Price | Title Company |
|---|---|---|---|
| Snyder Lacey A | -- | Hbi Title Services | |
| Snyder Lacey A | -- | Hbi Title | |
| Murray Lacey A | $70,000 | None Available | |
| Household Realty Corporation | -- | Attorney |
Source: Public Records
Mortgage History
| Date | Status | Borrower | Loan Amount |
|---|---|---|---|
| Open | Snyder Lacey A | $126,500 | |
| Previous Owner | Snyder Lacey A | $75,000 | |
| Previous Owner | Murray Lacey A | $68,225 |
Source: Public Records
Tax History Compared to Growth
Tax History
| Year | Tax Paid | Tax Assessment Tax Assessment Total Assessment is a certain percentage of the fair market value that is determined by local assessors to be the total taxable value of land and additions on the property. | Land | Improvement |
|---|---|---|---|---|
| 2024 | $3,556 | $69,664 | $13,230 | $56,434 |
| 2023 | $2,843 | $49,203 | $11,365 | $37,839 |
| 2022 | $2,552 | $49,203 | $11,365 | $37,839 |
| 2021 | $2,562 | $49,203 | $11,365 | $37,839 |
| 2020 | $2,187 | $38,840 | $8,970 | $29,870 |
| 2019 | $2,182 | $38,840 | $8,970 | $29,870 |
| 2018 | $2,295 | $38,840 | $8,970 | $29,870 |
| 2017 | $2,407 | $39,650 | $8,830 | $30,820 |
| 2016 | $2,444 | $39,650 | $8,830 | $30,820 |
| 2015 | $2,479 | $39,650 | $8,830 | $30,820 |
| 2014 | $2,402 | $37,410 | $8,330 | $29,080 |
| 2013 | $2,426 | $37,410 | $8,330 | $29,080 |
Source: Public Records
Map
Nearby Homes
- 5962 Cornell Ave
- 6111 Cornell Blvd
- 5889 Cornell Ave
- 6180 Olive Ave
- 6047 Opal St
- 33948 Honeysuckle Ln Unit 58
- 5895 Joanne Ct
- 5741 Jaycox Rd
- 6538 Pitts Blvd
- 6192 Jaycox Rd
- 6044 Main Ave
- 5533 Opal St
- 34128 Gina Dr
- 5528 Robert Ct
- 33995 Gloria Ave
- 34192 Gail Dr
- 5930 Eastview Ave
- 5835 Broad Blvd
- 5919 Ridgeview Blvd
- V/L Aspen St
- 6021 Wallace Blvd
- 6039 Wallace Blvd
- 6045 Wallace Blvd
- 6009 Wallace Blvd
- 6024 Cornell Blvd
- 6030 Wallace Blvd
- 6020 Cornell Blvd
- 6062 Cornell Blvd
- 6065 Wallace Blvd
- 6044 Wallace Blvd
- 6020 Wallace Blvd
- 5998 Wallace Blvd
- 6056 Wallace Blvd
- 6012 Cornell Blvd
- 6070 Cornell Blvd
- 6073 Wallace Blvd
- 6068 Wallace Blvd
- 5977 Wallace Blvd
- 5976 Wallace Blvd
- 6082 Cornell Blvd