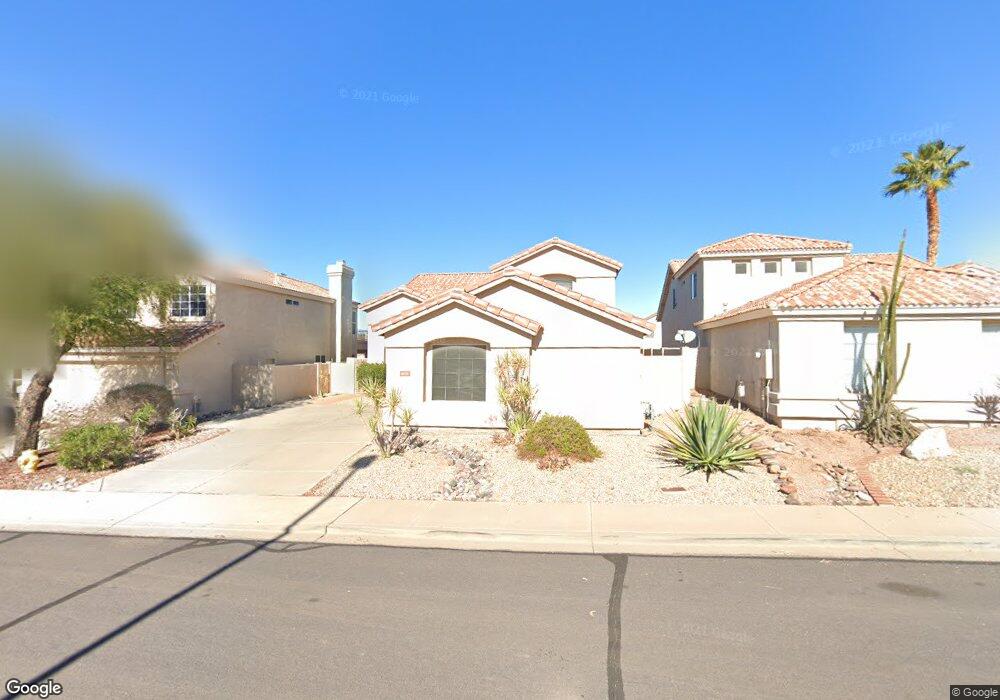
6032 E Sayan Cir Mesa, AZ 85215
Red Mountain Ranch NeighborhoodEstimated Value: $452,135 - $536,000
Studio
3
Baths
2,114
Sq Ft
$238/Sq Ft
Est. Value
About This Home
This home is located at 6032 E Sayan Cir, Mesa, AZ 85215 and is currently estimated at $504,034, approximately $238 per square foot. 6032 E Sayan Cir is a home located in Maricopa County with nearby schools including Red Mountain Ranch Elementary School, Franklin at Brimhall Elementary School, and Franklin West Elementary School.
Ownership History
Date
Name
Owned For
Owner Type
Purchase Details
Closed on
Jun 25, 2003
Sold by
Krue John and Krue Margaret A
Bought by
Banning Elaine
Current Estimated Value
Home Financials for this Owner
Home Financials are based on the most recent Mortgage that was taken out on this home.
Original Mortgage
$105,900
Outstanding Balance
$45,023
Interest Rate
5.26%
Mortgage Type
Purchase Money Mortgage
Estimated Equity
$459,011
Purchase Details
Closed on
Apr 11, 1995
Sold by
Banning Richard David
Bought by
Banning Elaine
Purchase Details
Closed on
Dec 27, 1994
Sold by
Red Mountain Ranch Inc
Bought by
Saddleback Homes Ltd
Home Financials for this Owner
Home Financials are based on the most recent Mortgage that was taken out on this home.
Original Mortgage
$101,450
Interest Rate
9.2%
Mortgage Type
Seller Take Back
Create a Home Valuation Report for This Property
The Home Valuation Report is an in-depth analysis detailing your home's value as well as a comparison with similar homes in the area
Home Values in the Area
Average Home Value in this Area
Purchase History
| Date | Buyer | Sale Price | Title Company |
|---|---|---|---|
| Banning Elaine | -- | Capital Title Agency Inc | |
| Banning Elaine | -- | Old Republic Title Agency | |
| Banning Elaine | $132,953 | Old Republic Title Agency | |
| Saddleback Homes Ltd | $22,600 | Old Republic Title Agency |
Source: Public Records
Mortgage History
| Date | Status | Borrower | Loan Amount |
|---|---|---|---|
| Open | Banning Elaine | $105,900 | |
| Previous Owner | Saddleback Homes Ltd | $101,450 |
Source: Public Records
Tax History
| Year | Tax Paid | Tax Assessment Tax Assessment Total Assessment is a certain percentage of the fair market value that is determined by local assessors to be the total taxable value of land and additions on the property. | Land | Improvement |
|---|---|---|---|---|
| 2025 | $1,906 | $22,953 | -- | -- |
| 2024 | $1,927 | $21,860 | -- | -- |
| 2023 | $1,927 | $36,880 | $7,370 | $29,510 |
| 2022 | $1,885 | $28,330 | $5,660 | $22,670 |
| 2021 | $1,936 | $26,370 | $5,270 | $21,100 |
| 2020 | $1,910 | $21,520 | $4,300 | $17,220 |
| 2019 | $1,770 | $19,700 | $3,940 | $15,760 |
| 2018 | $1,690 | $19,080 | $3,810 | $15,270 |
| 2017 | $1,637 | $17,800 | $3,560 | $14,240 |
| 2016 | $1,607 | $17,160 | $3,430 | $13,730 |
| 2015 | $1,517 | $16,230 | $3,240 | $12,990 |
Source: Public Records
Map
Nearby Homes
- 3631 N San Gabriel
- 5934 E Redmont Dr
- 6050 E Rochelle St
- 5924 E Redmont Dr
- 5931 E Sierra Morena St
- 6036 E Roland St
- 5928 E Sierra Morena St
- 6227 E Star Valley St
- 6009 E Sanford Cir
- 6128 E Snowdon St
- 3513 N Kashmir
- 6133 E Saddleback St
- 6122 E Saddleback St
- 3943 N Santiago
- 4002 N San Gabriel
- 4015 N San Gabriel Cir
- 5721 E Scarlet St
- 5828 E Star Valley St
- 5632 E Sandia St
- 6459 E Raftriver St
- 6038 E Sayan Cir
- 6026 E Sayan Cir
- 6044 E Sayan Cir
- 6020 E Sayan Cir
- 6050 E Sayan Cir
- 6035 E Sayan Cir
- 6043 E Sayan Cir
- 6042 E Sayan Cir
- 6021 E Sayan Cir
- 6027 E Sierra Blanca St
- 6035 E Sierra Blanca St
- 6008 E Sayan Cir
- 6048 E Sayan Cir
- 6049 E Sayan Cir
- 6015 E Sayan Cir
- 6019 E Sierra Blanca St
- 6043 E Sierra Blanca St
- 6011 E Sierra Blanca St
- 6009 E Sayan Cir
- 6051 E Sierra Blanca St
Your Personal Tour Guide
Ask me questions while you tour the home.