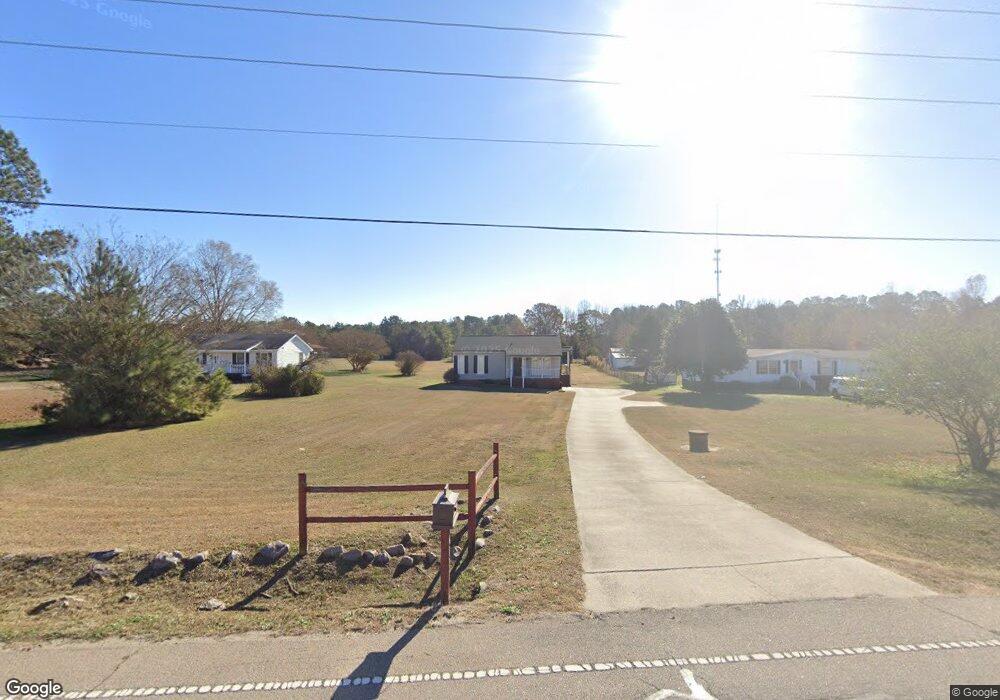
6032 Mitchell Mill Rd Zebulon, NC 27597
Estimated Value: $201,000 - $291,000
2
Beds
1
Bath
864
Sq Ft
$279/Sq Ft
Est. Value
About This Home
This home is located at 6032 Mitchell Mill Rd, Zebulon, NC 27597 and is currently estimated at $241,134, approximately $279 per square foot. 6032 Mitchell Mill Rd is a home located in Wake County with nearby schools including Rolesville Elementary School, Rolesville Middle School, and Rolesville High School.
Ownership History
Date
Name
Owned For
Owner Type
Purchase Details
Closed on
Nov 19, 2020
Sold by
Lind Edward S and Lind Jeanine H
Bought by
Lind Jeanine H
Current Estimated Value
Home Financials for this Owner
Home Financials are based on the most recent Mortgage that was taken out on this home.
Original Mortgage
$48,000
Outstanding Balance
$34,671
Interest Rate
2.8%
Mortgage Type
New Conventional
Estimated Equity
$206,463
Purchase Details
Closed on
Jul 18, 2013
Sold by
Mccants Marshall and Mccants Marjorie H
Bought by
Lind Edward S and Lind Jeanine H
Home Financials for this Owner
Home Financials are based on the most recent Mortgage that was taken out on this home.
Original Mortgage
$48,300
Interest Rate
3.96%
Mortgage Type
Purchase Money Mortgage
Purchase Details
Closed on
Sep 24, 2012
Sold by
Mccants Marshall
Bought by
Mccants Leon and Mccants Vinson
Create a Home Valuation Report for This Property
The Home Valuation Report is an in-depth analysis detailing your home's value as well as a comparison with similar homes in the area
Home Values in the Area
Average Home Value in this Area
Purchase History
| Date | Buyer | Sale Price | Title Company |
|---|---|---|---|
| Lind Jeanine H | -- | None Available | |
| Lind Edward S | $65,000 | None Available | |
| Mccants Leon | -- | None Available |
Source: Public Records
Mortgage History
| Date | Status | Borrower | Loan Amount |
|---|---|---|---|
| Open | Lind Jeanine H | $48,000 | |
| Closed | Lind Edward S | $48,300 |
Source: Public Records
Tax History Compared to Growth
Tax History
| Year | Tax Paid | Tax Assessment Tax Assessment Total Assessment is a certain percentage of the fair market value that is determined by local assessors to be the total taxable value of land and additions on the property. | Land | Improvement |
|---|---|---|---|---|
| 2025 | $1,031 | $158,074 | $45,000 | $113,074 |
| 2024 | $1,002 | $158,074 | $45,000 | $113,074 |
| 2023 | $875 | $109,633 | $34,000 | $75,633 |
| 2022 | $812 | $109,633 | $34,000 | $75,633 |
| 2021 | $790 | $109,633 | $34,000 | $75,633 |
| 2020 | $778 | $109,633 | $34,000 | $75,633 |
| 2019 | $768 | $91,575 | $24,000 | $67,575 |
| 2018 | $707 | $91,575 | $24,000 | $67,575 |
| 2017 | $671 | $91,575 | $24,000 | $67,575 |
| 2016 | $658 | $91,575 | $24,000 | $67,575 |
| 2015 | $746 | $104,550 | $40,000 | $64,550 |
| 2014 | $708 | $104,550 | $40,000 | $64,550 |
Source: Public Records
Map
Nearby Homes
- 3612 Bailey Meadows Dr
- 5833 Mitchell Mill Rd
- 3604 Bailey Meadows Dr
- 5709 Flowery Meadow Ct
- Norman Plan at Kalas Falls
- Jordan Plan at Kalas Falls
- Hampshire Plan at Kalas Falls
- Hartwell Plan at Kalas Falls
- Summit Plan at Kalas Falls
- Fleetwood Plan at Kalas Falls
- Wylie Plan at Kalas Falls
- 3608 Manly Farm Rd
- 3628 Manly Farm Rd
- 3904 Manly Farm Rd
- 0 Jones Cousins Way
- 6200 Emily Ln
- 5725 All Clear Ln
- 2205 Seraphic Way Unit 403
- 2201 Seraphic Way Unit 404
- 2208 Seraphic Way Unit 381
- 6036 Mitchell Mill Rd
- 6028 Mitchell Mill Rd
- 6000 Mitchell Mill Rd
- 6112 Mitchell Mill Rd
- 2004 Rolesville Rd
- 2008 Rolesville Rd
- 2000 Rolesville Rd
- 3817 Hartland Manor Ct
- 3813 Hartland Manor Ct
- 2016 Rolesville Rd
- 3805 Hartland Manor Ct
- 2112 Buczek Dr
- 3821 Hartland Manor Ct
- 1924 Rolesville Rd
- 6204 Mitchell Mill Rd
- 3737 Nether Ridge Rd
- 3737 Nether Ridge Rd Unit 1
- 3820 Hartland Manor Ct
- 3733 Nether Ridge Rd
- 3733 Nether Ridge Rd Unit 2