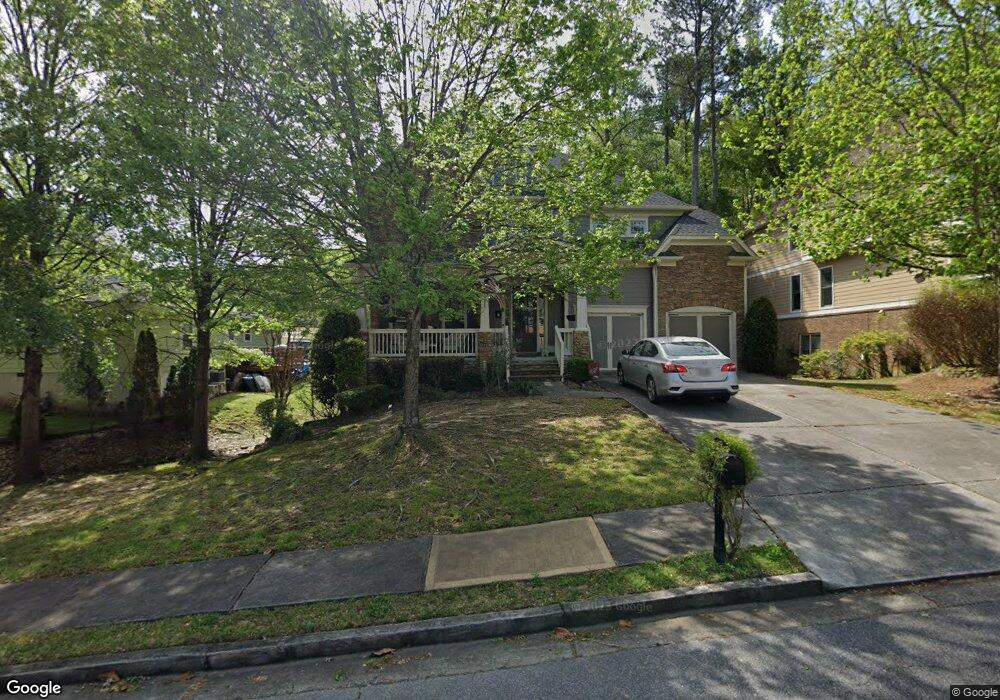
6032 Norcross Glen Trace Unit 1 Norcross, GA 30071
Estimated Value: $809,371 - $920,000
6
Beds
4
Baths
3,749
Sq Ft
$236/Sq Ft
Est. Value
About This Home
This home is located at 6032 Norcross Glen Trace Unit 1, Norcross, GA 30071 and is currently estimated at $884,593, approximately $235 per square foot. 6032 Norcross Glen Trace Unit 1 is a home located in Gwinnett County with nearby schools including Susan Stripling Elementary School, Pinckneyville Middle School, and Paul Duke STEM High School.
Ownership History
Date
Name
Owned For
Owner Type
Purchase Details
Closed on
May 5, 2025
Sold by
Martin Williams M
Bought by
Martin Shannon Shuman Trust and Martin Shannon Shuman
Current Estimated Value
Purchase Details
Closed on
Jun 24, 2016
Sold by
Stocks Richard W
Bought by
Martin Williams M and Martin Shannon S
Home Financials for this Owner
Home Financials are based on the most recent Mortgage that was taken out on this home.
Original Mortgage
$294,000
Interest Rate
3.64%
Purchase Details
Closed on
Nov 23, 2005
Sold by
Odwyer Homes Inc
Bought by
Stocks Richard W and Stocks Nancy E
Home Financials for this Owner
Home Financials are based on the most recent Mortgage that was taken out on this home.
Original Mortgage
$328,027
Interest Rate
1.25%
Purchase Details
Closed on
Mar 24, 2005
Sold by
Bolton Ridge Investments Llc
Bought by
Odwyer Homes Inc
Home Financials for this Owner
Home Financials are based on the most recent Mortgage that was taken out on this home.
Original Mortgage
$1,071,750
Interest Rate
5.74%
Create a Home Valuation Report for This Property
The Home Valuation Report is an in-depth analysis detailing your home's value as well as a comparison with similar homes in the area
Home Values in the Area
Average Home Value in this Area
Purchase History
| Date | Buyer | Sale Price | Title Company |
|---|---|---|---|
| Martin Shannon Shuman Trust | -- | -- | |
| Martin Williams M | $415,000 | -- | |
| Stocks Richard W | $410,100 | -- | |
| Odwyer Homes Inc | $350,000 | -- |
Source: Public Records
Mortgage History
| Date | Status | Borrower | Loan Amount |
|---|---|---|---|
| Previous Owner | Martin Williams M | $294,000 | |
| Previous Owner | Stocks Richard W | $328,027 | |
| Previous Owner | Odwyer Homes Inc | $1,071,750 |
Source: Public Records
Tax History Compared to Growth
Tax History
| Year | Tax Paid | Tax Assessment Tax Assessment Total Assessment is a certain percentage of the fair market value that is determined by local assessors to be the total taxable value of land and additions on the property. | Land | Improvement |
|---|---|---|---|---|
| 2025 | $10,613 | $335,840 | $50,160 | $285,680 |
| 2024 | $10,115 | $316,080 | $50,000 | $266,080 |
| 2023 | $10,115 | $300,760 | $37,600 | $263,160 |
| 2022 | $8,483 | $264,280 | $34,000 | $230,280 |
| 2021 | $7,354 | $224,200 | $44,920 | $179,280 |
| 2020 | $7,410 | $224,200 | $44,920 | $179,280 |
| 2019 | $7,336 | $178,440 | $32,000 | $146,440 |
| 2018 | $5,908 | $178,440 | $32,000 | $146,440 |
| 2016 | $5,747 | $173,800 | $28,000 | $145,800 |
| 2015 | $6,898 | $170,120 | $24,000 | $146,120 |
| 2014 | $5,292 | $156,840 | $24,000 | $132,840 |
Source: Public Records
Map
Nearby Homes
- 453 Hunter St
- 6000 Hunter Hall Ct
- 482 Nesbit St
- 519 Holcomb Bridge Rd
- 479 Holcomb Bridge Rd
- 695 Holcomb Bridge Rd
- 2798 Maddison Towns Ave
- 782 Holcomb Bridge Rd
- 6215 Atlantic Blvd
- 757 Sunset Dr
- 90 W Peachtree St
- 267 Longview Dr
- 231 Sunset Hills Dr
- 0 Peachtree Industrial Blvd Unit 10574761
- 0 Peachtree Industrial Blvd Unit 7624533
- 186 Wingo St
- 5766 Buford Hwy
- 204 Wingo St
- 265 Dogwood Walk Ln Unit 7
- 6023 Skellig St
- 6024 Norcross Glen Trace
- 6032 Norcross Glen Trace Unit 6032
- 6032 Norcross Glen Trace
- 465 Hunter St
- 6042 Norcross Glen Trace NW
- 6031 Norcross Glen Trace
- 6041 Norcross Glen Trace
- 496 Hunter St
- 6052 Norcross Glen Trace
- 6008 Kenn Manor Way
- 470 Hunter St
- 6008 Kenn Manor Way
- 6065 Hunter Hall Ct
- 480 Hunter St
- 6081 Norcross Glen Trace
- 6062 Norcross Glen Trace
- 450 Hunter St
- 6072 Norcross Glen Trace
- 6055 Hunter Hall Ct
- 6055 Hunter Hall Ct Unit 2