Estimated Value: $585,000 - $767,000
4
Beds
4
Baths
2,961
Sq Ft
$224/Sq Ft
Est. Value
About This Home
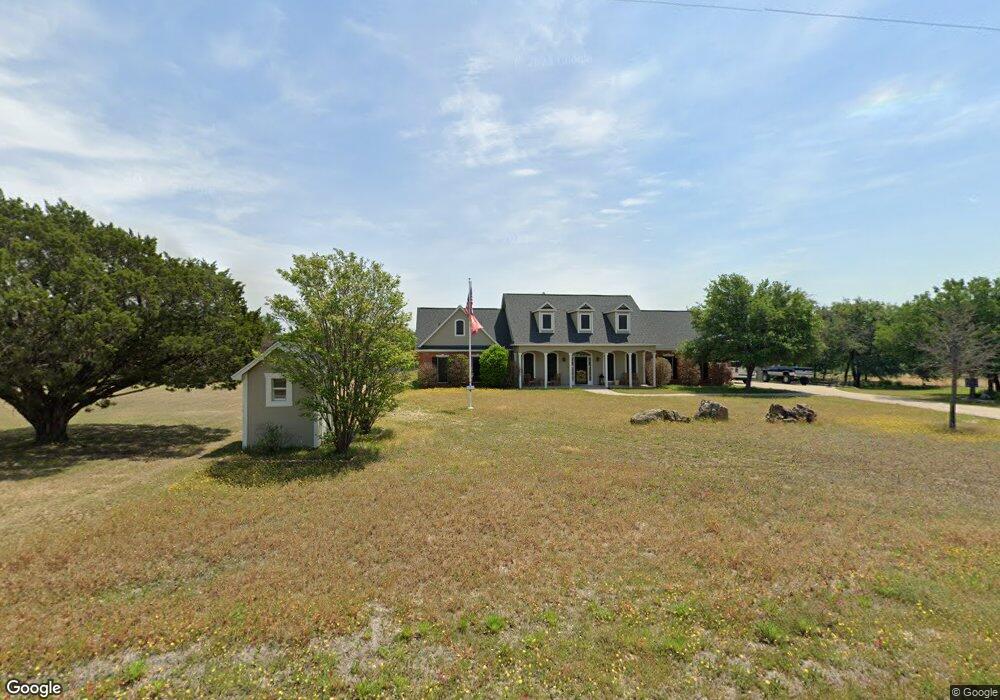
This home is located at 6033 Grace Ln, Azle, TX 76020 and is currently estimated at $663,469, approximately $224 per square foot. 6033 Grace Ln is a home located in Parker County with nearby schools including Silver Creek Elementary School, Azle Elementary School, and Azle Junior High School.
Ownership History
Date
Name
Owned For
Owner Type
Purchase Details
Closed on
Jun 24, 2014
Sold by
Lancaster Nicholaus R and Lancaster Candice M
Bought by
Hunt Clint
Current Estimated Value
Home Financials for this Owner
Home Financials are based on the most recent Mortgage that was taken out on this home.
Original Mortgage
$286,020
Outstanding Balance
$217,798
Interest Rate
4.23%
Mortgage Type
VA
Estimated Equity
$445,671
Purchase Details
Closed on
Dec 5, 2006
Sold by
Edwards Sean F and Edwards Lisa M
Bought by
Hunt Clint
Purchase Details
Closed on
Jul 28, 2004
Sold by
Blair Anita
Bought by
Hunt Clint
Purchase Details
Closed on
Jul 22, 2004
Sold by
Woods Bill and Woods Karen
Bought by
Hunt Clint
Purchase Details
Closed on
Apr 17, 1998
Bought by
Hunt Clint
Purchase Details
Closed on
Jan 1, 1901
Bought by
Hunt Clint
Create a Home Valuation Report for This Property
The Home Valuation Report is an in-depth analysis detailing your home's value as well as a comparison with similar homes in the area
Home Values in the Area
Average Home Value in this Area
Purchase History
| Date | Buyer | Sale Price | Title Company |
|---|---|---|---|
| Hunt Clint | -- | Providence Title Company | |
| Hunt Clint | -- | -- | |
| Hunt Clint | -- | -- | |
| Hunt Clint | -- | -- | |
| Hunt Clint | -- | -- | |
| Hunt Clint | -- | -- |
Source: Public Records
Mortgage History
| Date | Status | Borrower | Loan Amount |
|---|---|---|---|
| Open | Hunt Clint | $286,020 |
Source: Public Records
Tax History Compared to Growth
Tax History
| Year | Tax Paid | Tax Assessment Tax Assessment Total Assessment is a certain percentage of the fair market value that is determined by local assessors to be the total taxable value of land and additions on the property. | Land | Improvement |
|---|---|---|---|---|
| 2025 | -- | $711,640 | $295,980 | $415,660 |
| 2024 | -- | $702,500 | $254,980 | $447,520 |
| 2023 | $6,976 | $433,710 | $0 | $0 |
| 2022 | $6,963 | $376,290 | $72,200 | $304,090 |
| 2021 | $7,295 | $376,290 | $72,200 | $304,090 |
| 2020 | $6,718 | $348,370 | $72,200 | $276,170 |
| 2019 | $6,566 | $348,370 | $72,200 | $276,170 |
| 2018 | $5,988 | $292,070 | $72,200 | $219,870 |
| 2017 | $5,479 | $292,070 | $72,200 | $219,870 |
| 2016 | $4,981 | $254,950 | $56,870 | $198,080 |
| 2015 | $1,836 | $254,950 | $56,870 | $198,080 |
| 2014 | $4,117 | $220,760 | $56,870 | $163,890 |
Source: Public Records
Map
Nearby Homes
- 108 E Shangri la Dr
- 126 Cedar Creek Dr
- 4000 Randolph Ln
- 225 W Shangri la Dr
- 116 Scenery Hill Dr
- 100 Tiffany Ct
- 101 Tiffany Ct
- 115 Cedar Mountain Dr
- 412 Skyview Ln
- 194 Cedar Mountain Dr
- 145 Clayton Rd
- 105 Beaver Creek Dr
- 177 Lost Oak Dr
- 2010 Spring Ct
- 2010 Spring Ct Unit A
- 2014 Spring Ct Unit 2
- 2014 Spring Ct
- 405 Red Roan Ridge
- 200 Sorrel Ln
- 1390 Mary Dr