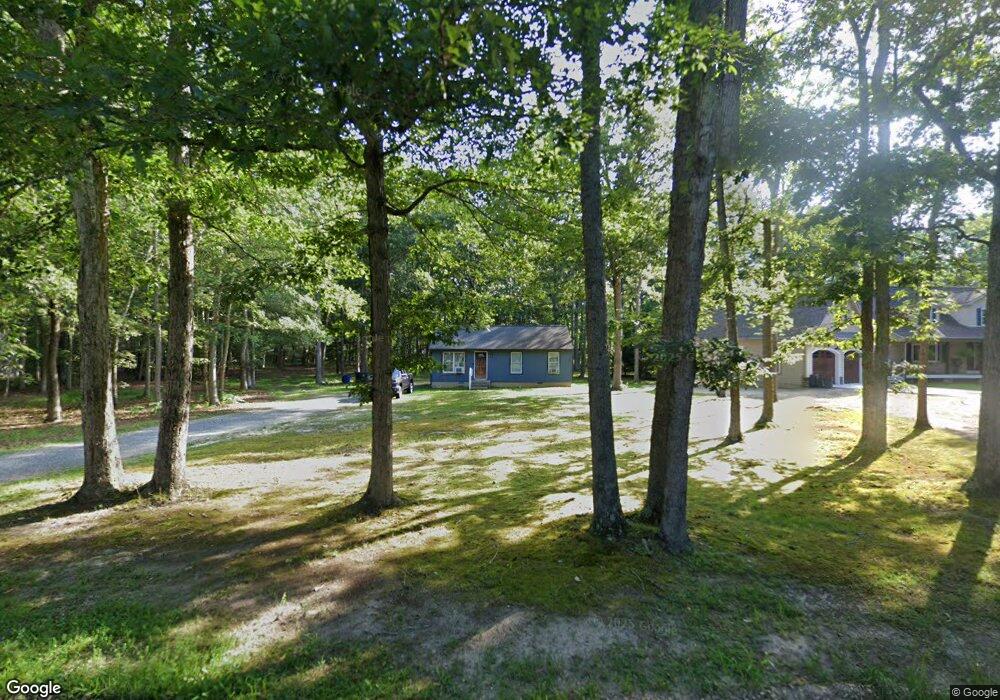
6033 Peach St Mays Landing, NJ 08330
Estimated Value: $223,192 - $324,000
--
Bed
--
Bath
864
Sq Ft
$298/Sq Ft
Est. Value
About This Home
This home is located at 6033 Peach St, Mays Landing, NJ 08330 and is currently estimated at $257,048, approximately $297 per square foot. 6033 Peach St is a home located in Atlantic County with nearby schools including Joseph Shaner School, George L. Hess Educational Complex, and William Davies Middle School.
Ownership History
Date
Name
Owned For
Owner Type
Purchase Details
Closed on
Apr 1, 1996
Sold by
Mcanney Charles C
Bought by
Grabel Brian M and Gabriel Melissa F
Current Estimated Value
Home Financials for this Owner
Home Financials are based on the most recent Mortgage that was taken out on this home.
Original Mortgage
$74,900
Outstanding Balance
$3,375
Interest Rate
6.9%
Mortgage Type
FHA
Estimated Equity
$253,673
Purchase Details
Closed on
Feb 10, 1993
Sold by
Mcanney Donna M
Bought by
Mcanney Charles C
Create a Home Valuation Report for This Property
The Home Valuation Report is an in-depth analysis detailing your home's value as well as a comparison with similar homes in the area
Home Values in the Area
Average Home Value in this Area
Purchase History
| Date | Buyer | Sale Price | Title Company |
|---|---|---|---|
| Grabel Brian M | $75,000 | Congress Title Corp | |
| Mcanney Charles C | -- | -- |
Source: Public Records
Mortgage History
| Date | Status | Borrower | Loan Amount |
|---|---|---|---|
| Open | Grabel Brian M | $74,900 |
Source: Public Records
Tax History Compared to Growth
Tax History
| Year | Tax Paid | Tax Assessment Tax Assessment Total Assessment is a certain percentage of the fair market value that is determined by local assessors to be the total taxable value of land and additions on the property. | Land | Improvement |
|---|---|---|---|---|
| 2025 | $4,152 | $121,000 | $39,000 | $82,000 |
| 2024 | $4,152 | $121,000 | $39,000 | $82,000 |
| 2023 | $3,903 | $121,000 | $39,000 | $82,000 |
| 2022 | $3,903 | $121,000 | $39,000 | $82,000 |
| 2021 | $3,895 | $121,000 | $39,000 | $82,000 |
| 2020 | $3,895 | $121,000 | $39,000 | $82,000 |
| 2019 | $3,905 | $121,000 | $39,000 | $82,000 |
| 2018 | $3,768 | $121,000 | $39,000 | $82,000 |
| 2017 | $3,709 | $121,000 | $39,000 | $82,000 |
| 2016 | $3,605 | $121,000 | $39,000 | $82,000 |
| 2015 | $3,482 | $121,000 | $39,000 | $82,000 |
| 2014 | $3,428 | $130,500 | $43,800 | $86,700 |
Source: Public Records
Map
Nearby Homes
- 6029 Peach St
- 6041 Peach St
- 6036 Peach St
- 6034 Hickory St
- 6028 Hickory St
- 6021 Peach St
- 6028 Peach St
- 6042 Hickory St
- 6020 Hickory St
- 6020 Peach St
- 6013 Peach St
- 6052 Hickory St
- 2525 Route 50
- 6012 Hickory St
- 6043 Hickory St
- 6012 Peach St
- 6031 Hickory St
- 6027 Hickory St
- 6108 Hickory St
- 6021 Hickory St