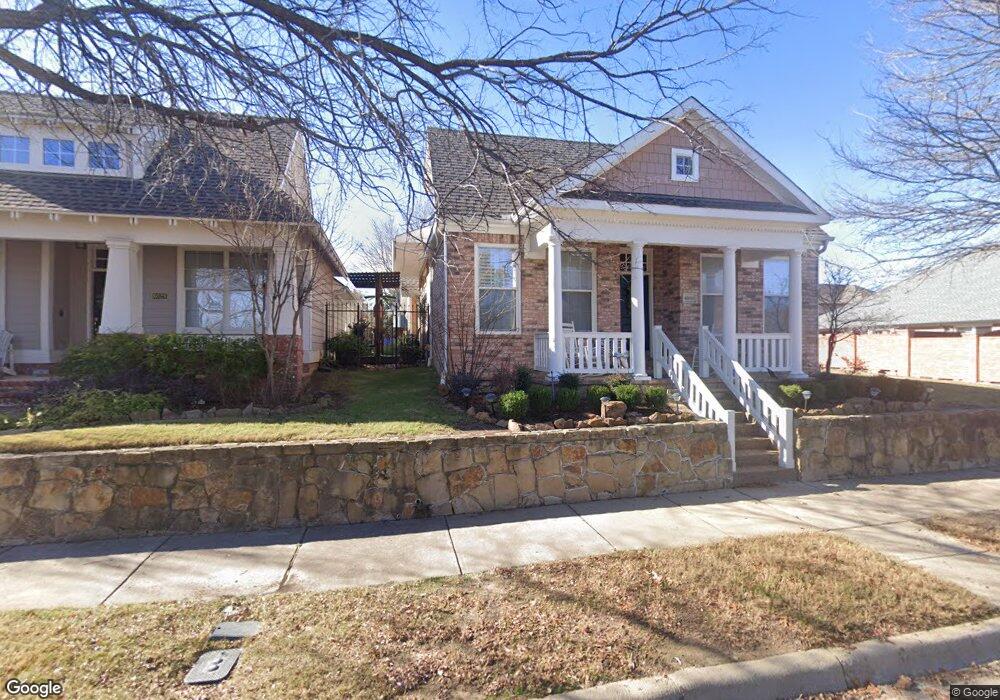
6033 Roaring Springs Dr North Richland Hills, TX 76180
Estimated Value: $419,144 - $468,000
3
Beds
2
Baths
1,683
Sq Ft
$266/Sq Ft
Est. Value
About This Home
This home is located at 6033 Roaring Springs Dr, North Richland Hills, TX 76180 and is currently estimated at $448,286, approximately $266 per square foot. 6033 Roaring Springs Dr is a home located in Tarrant County with nearby schools including Walker Creek Elementary School, Smithfield Middle School, and Birdville High School.
Ownership History
Date
Name
Owned For
Owner Type
Purchase Details
Closed on
Apr 30, 2025
Sold by
Jordan Georgene E
Bought by
Jordan Family Trust and Jordan
Current Estimated Value
Purchase Details
Closed on
Feb 23, 2010
Sold by
Secoy Owen W and Secoy Kathi R
Bought by
Jordan Georgene E
Home Financials for this Owner
Home Financials are based on the most recent Mortgage that was taken out on this home.
Original Mortgage
$164,960
Interest Rate
4.98%
Mortgage Type
New Conventional
Purchase Details
Closed on
Aug 29, 2003
Sold by
Cambridge Homes Inc
Bought by
Secoy Owen W and Secoy Kathi R
Home Financials for this Owner
Home Financials are based on the most recent Mortgage that was taken out on this home.
Original Mortgage
$87,300
Interest Rate
5.87%
Mortgage Type
Purchase Money Mortgage
Create a Home Valuation Report for This Property
The Home Valuation Report is an in-depth analysis detailing your home's value as well as a comparison with similar homes in the area
Home Values in the Area
Average Home Value in this Area
Purchase History
| Date | Buyer | Sale Price | Title Company |
|---|---|---|---|
| Jordan Family Trust | -- | None Listed On Document | |
| Jordan Georgene E | -- | Alamo Title Company | |
| Secoy Owen W | -- | American Title Mesquite |
Source: Public Records
Mortgage History
| Date | Status | Borrower | Loan Amount |
|---|---|---|---|
| Previous Owner | Jordan Georgene E | $164,960 | |
| Previous Owner | Secoy Owen W | $87,300 |
Source: Public Records
Tax History Compared to Growth
Tax History
| Year | Tax Paid | Tax Assessment Tax Assessment Total Assessment is a certain percentage of the fair market value that is determined by local assessors to be the total taxable value of land and additions on the property. | Land | Improvement |
|---|---|---|---|---|
| 2025 | $2,872 | $370,000 | $45,858 | $324,142 |
| 2024 | $2,872 | $404,387 | $45,858 | $358,529 |
| 2023 | $7,786 | $372,000 | $45,858 | $326,142 |
| 2022 | $7,765 | $339,846 | $45,858 | $293,988 |
| 2021 | $7,464 | $293,338 | $67,500 | $225,838 |
| 2020 | $7,301 | $286,920 | $67,500 | $219,420 |
| 2019 | $7,503 | $297,980 | $67,500 | $230,480 |
| 2018 | $4,721 | $259,000 | $52,500 | $206,500 |
| 2017 | $6,466 | $259,000 | $52,500 | $206,500 |
| 2016 | $5,878 | $224,723 | $30,000 | $194,723 |
| 2015 | $4,938 | $198,600 | $30,000 | $168,600 |
| 2014 | $4,938 | $198,600 | $30,000 | $168,600 |
Source: Public Records
Map
Nearby Homes
- 8240 Bridge St
- 6113 Cliffbrook Dr
- 6017 Avalon St
- 6250 Shirley Dr
- 8020 Bridge St
- 8057 Caladium Dr
- 8321 Bridge St
- 7800 Mockingbird Ln Unit 29
- 7800 Mockingbird Ln Unit 81
- 7800 Mockingbird Ln Unit 73
- 7800 Mockingbird Ln Unit 43
- 7800 Mockingbird Ln Unit 205
- 5920 Pedernales Ridge
- 0 Mid Cities Blvd
- 6116 Morningside Dr
- 6137 Marquita Mews
- 7713 Deaver Dr
- 8740 Ice House Dr
- 7704 Terry Dr
- 8748 Morris Mews
- 6029 Roaring Springs Dr
- 6025 Roaring Springs Dr
- 6101 Roaring Springs Dr
- 8209 Bridge St
- 8205 Bridge St
- 8213 Bridge St
- 6021 Roaring Springs Dr
- 8217 Bridge St
- 8241 Bridge St
- 6100 Roaring Springs Dr
- 6100 Pleasant Dream St
- 6105 Roaring Springs Dr
- 8221 Bridge St
- 6104 Pleasant Dream St
- 6104 Roaring Springs Dr
- 6108 Pleasant Dream St
- 8236 Bridge St
- 8245 Bridge St
- 6109 Roaring Springs Dr
- 8224 Bridge St