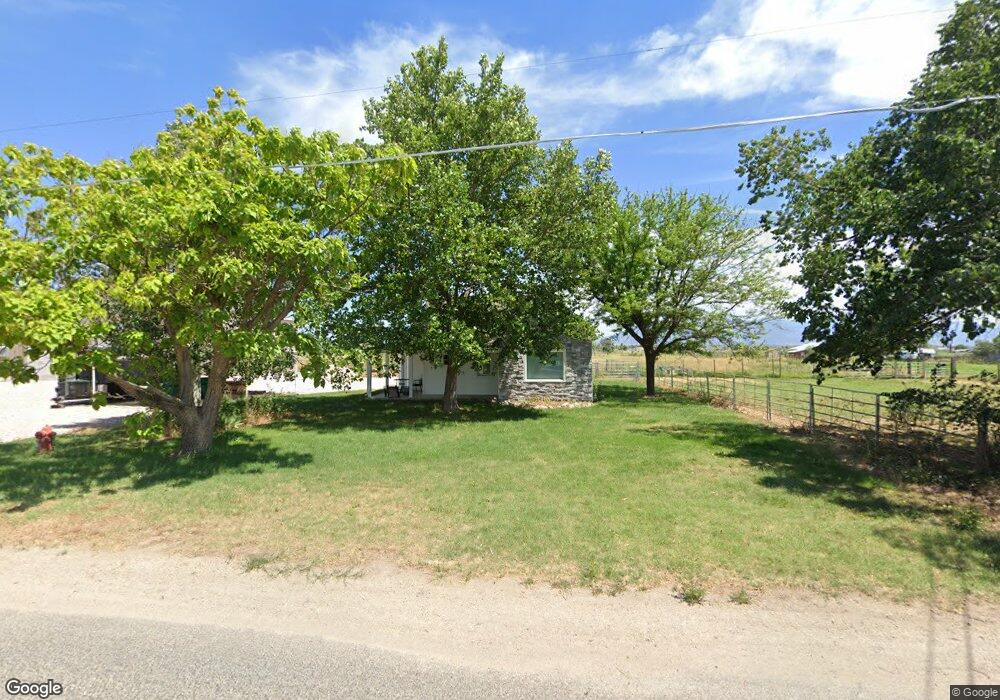
6034 S 7100 W Hooper, UT 84315
Estimated Value: $532,000 - $720,000
2
Beds
2
Baths
1,828
Sq Ft
$337/Sq Ft
Est. Value
About This Home
This home is located at 6034 S 7100 W, Hooper, UT 84315 and is currently estimated at $616,778, approximately $337 per square foot. 6034 S 7100 W is a home located in Weber County with nearby schools including Hooper School, Rocky Mountain Junior High School, and Fremont High School.
Ownership History
Date
Name
Owned For
Owner Type
Purchase Details
Closed on
Jun 25, 2001
Sold by
Jaramillo Jim E and Jaramillo Ann M
Bought by
Dominguez Casper and Dominguez Brenda L
Current Estimated Value
Home Financials for this Owner
Home Financials are based on the most recent Mortgage that was taken out on this home.
Original Mortgage
$84,000
Outstanding Balance
$32,536
Interest Rate
7.21%
Mortgage Type
Seller Take Back
Estimated Equity
$584,242
Purchase Details
Closed on
Aug 7, 1998
Sold by
Noall Sheila A
Bought by
Jaramillo Jim and Jaramillo Ann M
Home Financials for this Owner
Home Financials are based on the most recent Mortgage that was taken out on this home.
Original Mortgage
$80,000
Interest Rate
6.95%
Mortgage Type
Seller Take Back
Create a Home Valuation Report for This Property
The Home Valuation Report is an in-depth analysis detailing your home's value as well as a comparison with similar homes in the area
Home Values in the Area
Average Home Value in this Area
Purchase History
| Date | Buyer | Sale Price | Title Company |
|---|---|---|---|
| Dominguez Casper | -- | Associated Title | |
| Jaramillo Jim | -- | Associated Title Company |
Source: Public Records
Mortgage History
| Date | Status | Borrower | Loan Amount |
|---|---|---|---|
| Open | Dominguez Casper | $84,000 | |
| Previous Owner | Jaramillo Jim | $80,000 |
Source: Public Records
Tax History Compared to Growth
Tax History
| Year | Tax Paid | Tax Assessment Tax Assessment Total Assessment is a certain percentage of the fair market value that is determined by local assessors to be the total taxable value of land and additions on the property. | Land | Improvement |
|---|---|---|---|---|
| 2025 | $3,418 | $549,045 | $272,765 | $276,280 |
| 2024 | $3,300 | $540,998 | $272,765 | $268,233 |
| 2023 | $2,803 | $470,001 | $238,003 | $231,998 |
| 2022 | $2,695 | $462,000 | $197,997 | $264,003 |
| 2021 | $2,281 | $361,000 | $146,400 | $214,600 |
| 2020 | $2,118 | $302,000 | $136,408 | $165,592 |
| 2019 | $2,041 | $272,000 | $116,400 | $155,600 |
| 2018 | $1,925 | $242,000 | $116,400 | $125,600 |
| 2017 | $1,695 | $211,000 | $87,800 | $123,200 |
| 2016 | $1,725 | $131,878 | $62,307 | $69,571 |
| 2015 | $1,667 | $125,934 | $65,050 | $60,884 |
| 2014 | $1,610 | $118,457 | $65,050 | $53,407 |
Source: Public Records
Map
Nearby Homes