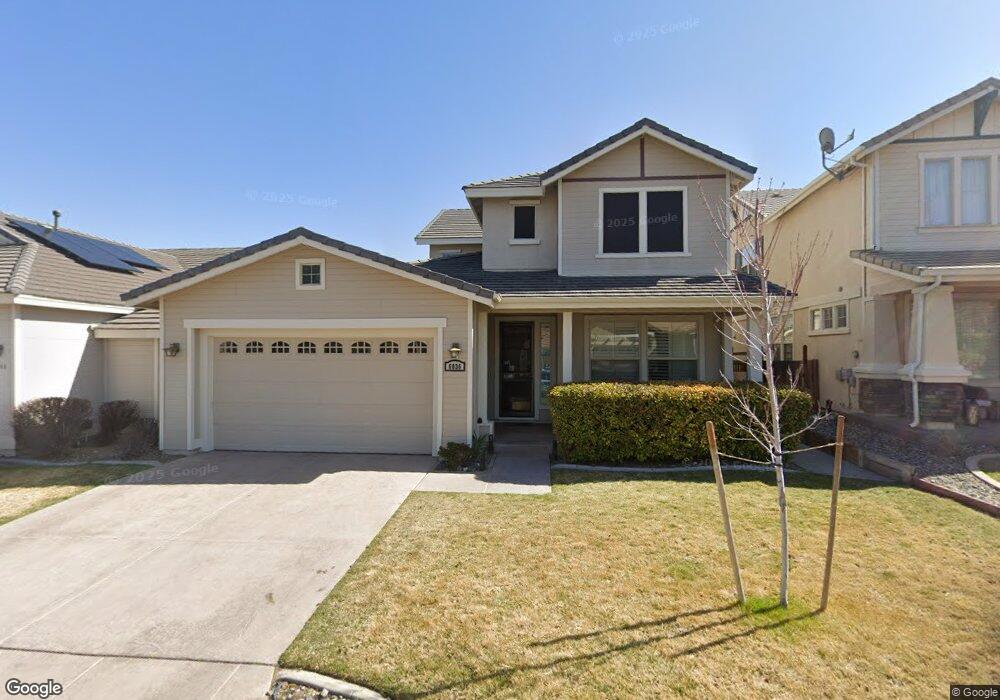
6036 Quintessa Dr Sparks, NV 89436
Wingfield Springs NeighborhoodEstimated Value: $571,000 - $644,000
3
Beds
3
Baths
2,425
Sq Ft
$245/Sq Ft
Est. Value
About This Home
This home is located at 6036 Quintessa Dr, Sparks, NV 89436 and is currently estimated at $594,539, approximately $245 per square foot. 6036 Quintessa Dr is a home located in Washoe County with nearby schools including Van Gorder Elementary School, Sky Ranch Middle School, and Spanish Springs High School.
Ownership History
Date
Name
Owned For
Owner Type
Purchase Details
Closed on
Oct 1, 2008
Sold by
Us Bank National Association
Bought by
Green David and Green Olga
Current Estimated Value
Home Financials for this Owner
Home Financials are based on the most recent Mortgage that was taken out on this home.
Original Mortgage
$251,060
Outstanding Balance
$160,564
Interest Rate
5.9%
Mortgage Type
FHA
Estimated Equity
$433,975
Purchase Details
Closed on
Apr 3, 2008
Sold by
Gregory Cynthia A
Bought by
Us Bank Na and Structured Asset Securities Corp Series
Purchase Details
Closed on
Jul 8, 2005
Sold by
Bella Vista At Wingfield Springs Llc
Bought by
Gregory Cynthia A
Home Financials for this Owner
Home Financials are based on the most recent Mortgage that was taken out on this home.
Original Mortgage
$344,751
Interest Rate
8.1%
Mortgage Type
Unknown
Purchase Details
Closed on
Jun 29, 2005
Sold by
Gregory Stephen
Bought by
Gregory Cynthia A
Home Financials for this Owner
Home Financials are based on the most recent Mortgage that was taken out on this home.
Original Mortgage
$344,751
Interest Rate
8.1%
Mortgage Type
Unknown
Create a Home Valuation Report for This Property
The Home Valuation Report is an in-depth analysis detailing your home's value as well as a comparison with similar homes in the area
Home Values in the Area
Average Home Value in this Area
Purchase History
| Date | Buyer | Sale Price | Title Company |
|---|---|---|---|
| Green David | $255,000 | First American Title Reno | |
| Us Bank Na | $294,995 | Ticor Title Reno | |
| Gregory Cynthia A | $406,000 | Founders Title Company Of Nv | |
| Gregory Cynthia A | -- | Founders Title Company Of Nv |
Source: Public Records
Mortgage History
| Date | Status | Borrower | Loan Amount |
|---|---|---|---|
| Open | Green David | $251,060 | |
| Previous Owner | Gregory Cynthia A | $344,751 |
Source: Public Records
Tax History Compared to Growth
Tax History
| Year | Tax Paid | Tax Assessment Tax Assessment Total Assessment is a certain percentage of the fair market value that is determined by local assessors to be the total taxable value of land and additions on the property. | Land | Improvement |
|---|---|---|---|---|
| 2026 | $2,538 | $158,238 | $44,056 | $114,182 |
| 2025 | $3,294 | $160,169 | $44,056 | $116,113 |
| 2024 | $3,294 | $153,324 | $36,376 | $116,949 |
| 2023 | $3,199 | $147,621 | $36,908 | $110,714 |
| 2022 | $3,106 | $122,404 | $30,457 | $91,947 |
| 2021 | $3,016 | $118,292 | $26,933 | $91,359 |
| 2020 | $2,925 | $119,469 | $27,997 | $91,472 |
| 2019 | $2,840 | $114,667 | $26,234 | $88,433 |
| 2018 | $2,757 | $105,217 | $18,853 | $86,364 |
| 2017 | $2,678 | $104,092 | $17,722 | $86,370 |
| 2016 | $2,610 | $104,646 | $16,791 | $87,855 |
| 2015 | $2,605 | $93,397 | $14,630 | $78,767 |
| 2014 | $2,529 | $81,499 | $12,535 | $68,964 |
| 2013 | -- | $67,293 | $10,175 | $57,118 |
Source: Public Records
Map
Nearby Homes
- 6036 Cielo Cir
- 5989 Solstice Dr
- 2661 Lawry Dr
- 2910 Albazano Ct
- 2353 Old Waverly Dr
- 6357 Peppergrass Dr
- 6767 Russian Thistle Dr
- 6641 Peppergrass Dr
- 6302 Cokenee Ct
- 6375 N Ginger Quill Ct
- 5448 Fossilstone Dr
- 5465 Spirit Ct
- 6313 Bonita Ct
- 6638 Aston Cir Unit 18
- 5410 Cactus Quartz Ct
- 6870 Pilot Peak Rd
- 5688 Spandrell Cir
- 6658 Abbotswood Dr
- 6348 Chilhowee Ct
- 6325 Firebee Ct
- 6044 Quintessa Dr
- 6026 Quintessa Dr
- 6021 Cielo Cir
- 6018 Quintessa Dr
- 6050 Quintessa Dr
- 6029 Cielo Cir
- 6008 Quintessa Dr
- 6019 Quintessa Dr
- 6059 Quintessa Dr
- 6056 Quintessa Dr
- 6051 Cielo Cir
- 6009 Quintessa Dr
- 6000 Quintessa Dr
- 6057 Cielo Cir
- 6016 Cielo Cir
- 6020 Cielo Cir
- 6066 Quintessa Dr
- 6010 Cielo Cir
- 6026 Cielo Cir
- 5999 Quintessa Dr