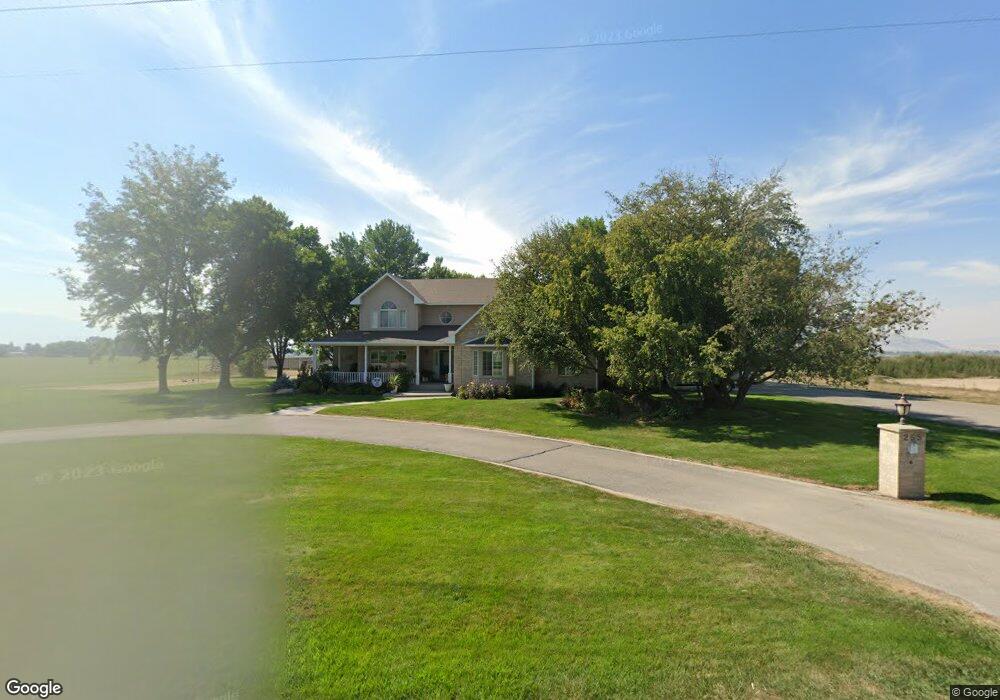
6037 N 800 W Smithfield, UT 84335
Estimated Value: $662,000 - $1,053,553
--
Bed
--
Bath
3,424
Sq Ft
$251/Sq Ft
Est. Value
About This Home
This home is located at 6037 N 800 W, Smithfield, UT 84335 and is currently estimated at $857,777, approximately $250 per square foot. 6037 N 800 W is a home with nearby schools including Birch Creek School, North Cache Middle School, and White Pine Middle School.
Ownership History
Date
Name
Owned For
Owner Type
Purchase Details
Closed on
May 10, 2024
Sold by
Poulsen H Lamont H and Poulsen Connie
Bought by
Connie Poulsen Revocable Trust and Poulsen
Current Estimated Value
Purchase Details
Closed on
Aug 30, 2002
Sold by
Poulsen Perth and Oulsen Arvella Watts
Bought by
Poulsen Henry Lamont and Poulsen Connie
Create a Home Valuation Report for This Property
The Home Valuation Report is an in-depth analysis detailing your home's value as well as a comparison with similar homes in the area
Home Values in the Area
Average Home Value in this Area
Purchase History
| Date | Buyer | Sale Price | Title Company |
|---|---|---|---|
| Connie Poulsen Revocable Trust | -- | None Listed On Document | |
| Poulsen Henry Lamont | -- | -- |
Source: Public Records
Tax History Compared to Growth
Tax History
| Year | Tax Paid | Tax Assessment Tax Assessment Total Assessment is a certain percentage of the fair market value that is determined by local assessors to be the total taxable value of land and additions on the property. | Land | Improvement |
|---|---|---|---|---|
| 2025 | $3,081 | $503,675 | $0 | $0 |
| 2024 | $3,085 | $466,695 | $0 | $0 |
| 2023 | $3,288 | $465,245 | $0 | $0 |
| 2022 | $3,441 | $465,280 | $0 | $0 |
| 2021 | $3,336 | $717,140 | $167,500 | $549,640 |
| 2020 | $3,108 | $633,400 | $167,500 | $465,900 |
| 2019 | $2,883 | $549,034 | $126,500 | $422,534 |
| 2018 | $2,652 | $491,780 | $126,500 | $365,280 |
| 2017 | $2,575 | $245,250 | $0 | $0 |
| 2016 | $2,607 | $245,210 | $0 | $0 |
| 2015 | $2,600 | $245,170 | $0 | $0 |
| 2014 | $2,319 | $225,620 | $0 | $0 |
| 2013 | -- | $225,910 | $0 | $0 |
Source: Public Records
Map
Nearby Homes
- 353 N 770 W
- 669 W 575 N Unit 552
- 669 W 575 N
- 581 W 230 N
- 610 W 100 N Unit 18
- 698 N 650 W Unit 640
- 517 W 260 N
- 527 N 770 W
- 544 N 800 W
- Hawthorn Townhomes Unit B Plan at Golden Forest - Golden Forest Townhomes
- Princeton Plan at Golden Forest - Golden Forest Single Family
- Fairview Plan at Golden Forest - Golden Forest Single Family
- Richmond Plan at Golden Forest - Golden Forest Single Family
- Ashland Plan at Golden Forest - Golden Forest Single Family
- Magnolia Plan at Golden Forest - Golden Forest Single Family
- Athens Plan at Golden Forest - Golden Forest Single Family
- Madison Plan at Golden Forest - Golden Forest Single Family
- Highland Plan at Golden Forest - Golden Forest Single Family
- Hawthorn Townhomes Unit A Plan at Golden Forest - Golden Forest Townhomes
- Ashton Townhome Plan at Golden Forest - Golden Forest Townhomes