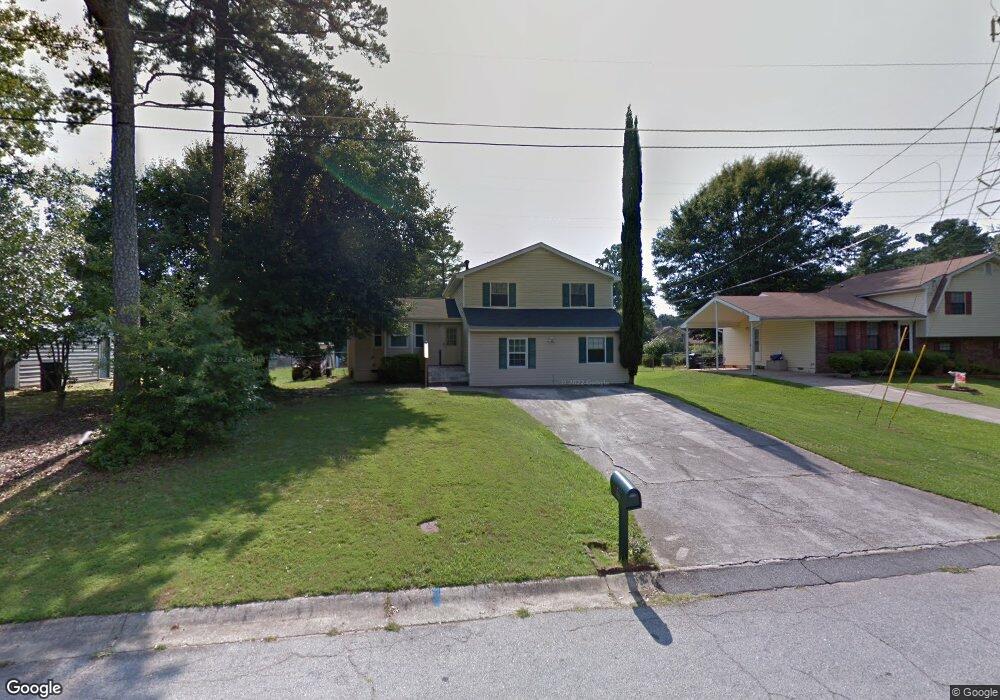
6037 Yale Ct Morrow, GA 30260
Estimated Value: $193,000 - $271,000
5
Beds
2
Baths
1,758
Sq Ft
$136/Sq Ft
Est. Value
About This Home
This home is located at 6037 Yale Ct, Morrow, GA 30260 and is currently estimated at $238,403, approximately $135 per square foot. 6037 Yale Ct is a home located in Clayton County with nearby schools including Morrow Elementary School, Morrow Middle School, and Morrow High School.
Ownership History
Date
Name
Owned For
Owner Type
Purchase Details
Closed on
Sep 28, 2022
Sold by
Persaud Anil
Bought by
Appleton3 Llc
Current Estimated Value
Purchase Details
Closed on
Jun 8, 2011
Sold by
Suntrust Bk
Bought by
Persaud Anil
Home Financials for this Owner
Home Financials are based on the most recent Mortgage that was taken out on this home.
Original Mortgage
$45,808
Interest Rate
4.5%
Mortgage Type
FHA
Purchase Details
Closed on
Apr 1, 2005
Sold by
Sanchez Jose A
Bought by
Rodriguez Vianey A
Home Financials for this Owner
Home Financials are based on the most recent Mortgage that was taken out on this home.
Original Mortgage
$127,300
Interest Rate
9.5%
Mortgage Type
New Conventional
Purchase Details
Closed on
Jul 29, 1999
Sold by
Thompson Timothy L and Thompson Linda G
Bought by
Sanchez Jose A
Home Financials for this Owner
Home Financials are based on the most recent Mortgage that was taken out on this home.
Original Mortgage
$92,745
Interest Rate
7.66%
Mortgage Type
FHA
Create a Home Valuation Report for This Property
The Home Valuation Report is an in-depth analysis detailing your home's value as well as a comparison with similar homes in the area
Home Values in the Area
Average Home Value in this Area
Purchase History
| Date | Buyer | Sale Price | Title Company |
|---|---|---|---|
| Appleton3 Llc | -- | -- | |
| Persaud Anil | $47,000 | -- | |
| Rodriguez Vianey A | $134,000 | -- | |
| Sanchez Jose A | $94,000 | -- |
Source: Public Records
Mortgage History
| Date | Status | Borrower | Loan Amount |
|---|---|---|---|
| Previous Owner | Persaud Anil | $45,808 | |
| Previous Owner | Rodriguez Vianey A | $127,300 | |
| Previous Owner | Sanchez Jose A | $92,745 |
Source: Public Records
Tax History Compared to Growth
Tax History
| Year | Tax Paid | Tax Assessment Tax Assessment Total Assessment is a certain percentage of the fair market value that is determined by local assessors to be the total taxable value of land and additions on the property. | Land | Improvement |
|---|---|---|---|---|
| 2024 | $3,807 | $96,680 | $7,200 | $89,480 |
| 2023 | $3,401 | $94,200 | $7,200 | $87,000 |
| 2022 | $2,931 | $73,800 | $7,200 | $66,600 |
| 2021 | $2,492 | $62,200 | $7,200 | $55,000 |
| 2020 | $2,204 | $54,234 | $7,200 | $47,034 |
| 2019 | $1,752 | $42,305 | $6,400 | $35,905 |
| 2018 | $1,756 | $42,384 | $6,400 | $35,984 |
| 2017 | $1,429 | $34,247 | $6,400 | $27,847 |
| 2016 | $1,277 | $30,512 | $6,400 | $24,112 |
| 2015 | $1,152 | $0 | $0 | $0 |
| 2014 | $1,202 | $29,330 | $6,400 | $22,930 |
Source: Public Records
Map
Nearby Homes
- 5992 Twilight Trail
- 1931 Cornell Way
- 6172 Princeton Ave Unit 6
- 1902 Mural Cir Unit 5
- 2057 Fort Trail
- The Rose Interior Plan at Sonata
- The Azalea Interior Plan at Sonata
- The Rose Exterior Plan at Sonata
- The Lily Interior Plan at Sonata
- The Daisy Exterior Plan at Sonata
- 1804 Carla Dr
- 2318 Santa fe St Unit 4
- 0 SE Old Rex Morrow Rd Unit 142 8001665
- 6177 Meadowwood Dr
- 0 Thompson Blvd
- 5812 Thompson Blvd
- 5816 Thompson Blvd
- 6178 Graceland Cir
- 6083 Reynolds Rd
- The Daisy Plan at Sonata
- 6045 Yale Ct
- 6029 Yale Ct
- 0 Yale Ct
- 6021 Yale Ct
- 6053 Yale Ct
- 1870 Oxford Dr
- 6032 Twilight Trail
- 6038 Twilight Trail Unit 2
- 6036 Yale Ct
- 6024 Twilight Trail
- 6044 Yale Ct Unit 3
- 6017 Yale Ct Unit 3
- 6028 Yale Ct
- 6050 Yale Ct Unit 3
- 6050 Twilight Trail
- 6056 Yale Ct Unit 3
- 6018 Twilight Trail
- 1873 Oxford Dr
- 6013 Yale Ct
- 1865 Oxford Dr