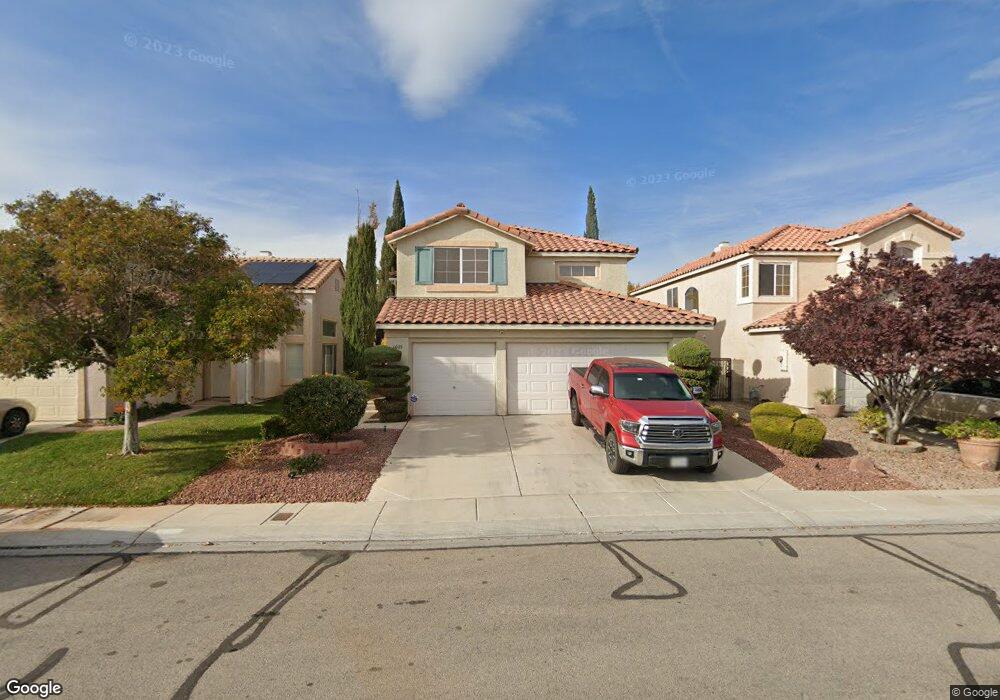
6039 Dawn View Ln North Las Vegas, NV 89031
Craig Ranch NeighborhoodEstimated Value: $439,000 - $484,000
5
Beds
3
Baths
2,046
Sq Ft
$229/Sq Ft
Est. Value
About This Home
This home is located at 6039 Dawn View Ln, North Las Vegas, NV 89031 and is currently estimated at $467,755, approximately $228 per square foot. 6039 Dawn View Ln is a home located in Clark County with nearby schools including Lee Antonello Elementary School, Brian & Teri Cram Middle School, and Legacy High School.
Ownership History
Date
Name
Owned For
Owner Type
Purchase Details
Closed on
Jan 12, 2024
Sold by
Kazel Wendy
Bought by
Piontkowski Paul K
Current Estimated Value
Home Financials for this Owner
Home Financials are based on the most recent Mortgage that was taken out on this home.
Original Mortgage
$84,000
Outstanding Balance
$82,603
Interest Rate
7.22%
Mortgage Type
New Conventional
Estimated Equity
$385,152
Purchase Details
Closed on
Feb 13, 1998
Sold by
Kazel Wendy and Kazel Scott
Bought by
Kazel Wendy
Purchase Details
Closed on
Oct 14, 1997
Sold by
Pardee Construction Company Of Nevada
Bought by
Kazel Wendy and Kazel Scott
Home Financials for this Owner
Home Financials are based on the most recent Mortgage that was taken out on this home.
Original Mortgage
$140,556
Interest Rate
7.49%
Mortgage Type
VA
Create a Home Valuation Report for This Property
The Home Valuation Report is an in-depth analysis detailing your home's value as well as a comparison with similar homes in the area
Home Values in the Area
Average Home Value in this Area
Purchase History
| Date | Buyer | Sale Price | Title Company |
|---|---|---|---|
| Piontkowski Paul K | -- | Security 1St Title | |
| Kazel Wendy | -- | -- | |
| Kazel Wendy | $138,000 | National Title Company |
Source: Public Records
Mortgage History
| Date | Status | Borrower | Loan Amount |
|---|---|---|---|
| Open | Piontkowski Paul K | $84,000 | |
| Previous Owner | Kazel Wendy | $140,556 |
Source: Public Records
Tax History Compared to Growth
Tax History
| Year | Tax Paid | Tax Assessment Tax Assessment Total Assessment is a certain percentage of the fair market value that is determined by local assessors to be the total taxable value of land and additions on the property. | Land | Improvement |
|---|---|---|---|---|
| 2025 | $1,787 | $112,501 | $31,500 | $81,001 |
| 2024 | $1,655 | $112,501 | $31,500 | $81,001 |
| 2023 | $1,655 | $105,646 | $29,050 | $76,596 |
| 2022 | $1,607 | $92,700 | $22,400 | $70,300 |
| 2021 | $1,561 | $87,934 | $21,000 | $66,934 |
| 2020 | $1,512 | $87,079 | $20,650 | $66,429 |
| 2019 | $1,468 | $83,257 | $17,850 | $65,407 |
| 2018 | $1,425 | $77,249 | $14,350 | $62,899 |
| 2017 | $2,565 | $76,479 | $12,600 | $63,879 |
| 2016 | $1,351 | $71,285 | $8,750 | $62,535 |
| 2015 | $1,347 | $57,408 | $7,000 | $50,408 |
| 2014 | $1,308 | $38,789 | $7,000 | $31,789 |
Source: Public Records
Map
Nearby Homes
- 1903 Ginger Blossom Ave
- 6129 Bedrock Ct
- 2214 Akamine Ave
- 1910 Night Shadow Ave
- 5904 Arrowleaf St
- 2265 Dixon Springs Ave
- 2261 Dalton Ridge Ct
- 6056 Fort Wayne Ct
- 2305 Dalton Ridge Ct
- 2414 Lahaina Ct
- 2265 Stone Breeze Ave
- 1901 Desert Sage Ave
- 5823 Rose Sage St
- 2426 Inlet Beach Ct
- 1611 Spotted Pony Dr
- 2116 W El Campo Grande Ave
- 5816 Elphin Ct
- 5738 Bear Springs St
- 6126 Leaning Rock Ct
- 2114 Maui Surf Ave
- 6035 Dawn View Ln
- 6043 Dawn View Ln
- 6031 Dawn View Ln
- 6047 Dawn View Ln
- 6051 Dawn View Ln
- 6051 Dawn View Ln
- 6027 Dawn View Ln
- 1926 Giant Rock Place
- 6055 Dawn View Ln
- 6023 Dawn View Ln
- 1925 Badger Canyon Ave
- 1922 Giant Rock Place
- 1927 Giant Rock Place
- 6034 Marvin St
- 6038 Marvin St
- 6103 Dawn View Ln
- 6019 Dawn View Ln
- 1921 Badger Canyon Ave
- 6030 Marvin St
- 1918 Giant Rock Place