Estimated Value: $249,207 - $298,000
--
Bed
2
Baths
1,590
Sq Ft
$171/Sq Ft
Est. Value
About This Home
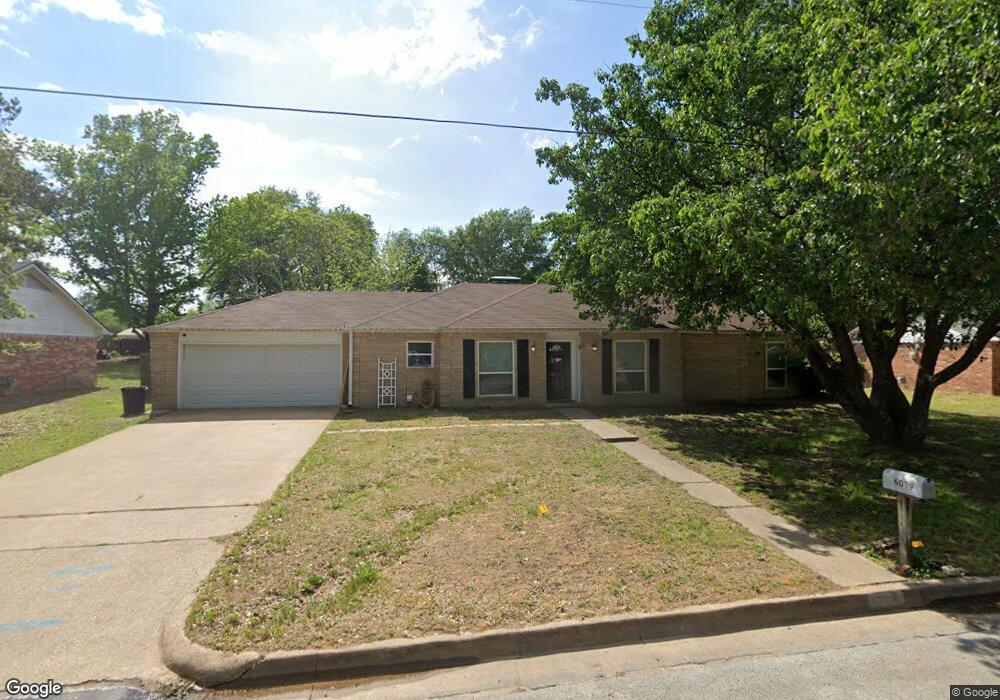
This home is located at 6039 Whispering Ln, Tyler, TX 75707 and is currently estimated at $272,552, approximately $171 per square foot. 6039 Whispering Ln is a home located in Smith County with nearby schools including Mozelle Brown Elementary School, J.W. Holloway Sixth Grade School, and Whitehouse High School.
Ownership History
Date
Name
Owned For
Owner Type
Purchase Details
Closed on
Aug 21, 2020
Sold by
Smith John R and Smith Jill R
Bought by
Milburn Michael A and Milburn Rhonda R
Current Estimated Value
Home Financials for this Owner
Home Financials are based on the most recent Mortgage that was taken out on this home.
Original Mortgage
$155,000
Outstanding Balance
$136,926
Interest Rate
2.9%
Mortgage Type
New Conventional
Estimated Equity
$135,626
Purchase Details
Closed on
Mar 31, 2005
Sold by
Smith John D and Smith Barbara L
Bought by
Ellsworth Debra
Home Financials for this Owner
Home Financials are based on the most recent Mortgage that was taken out on this home.
Original Mortgage
$88,609
Interest Rate
5.71%
Mortgage Type
FHA
Create a Home Valuation Report for This Property
The Home Valuation Report is an in-depth analysis detailing your home's value as well as a comparison with similar homes in the area
Home Values in the Area
Average Home Value in this Area
Purchase History
| Date | Buyer | Sale Price | Title Company |
|---|---|---|---|
| Milburn Michael A | -- | None Available | |
| Ellsworth Debra | -- | None Available |
Source: Public Records
Mortgage History
| Date | Status | Borrower | Loan Amount |
|---|---|---|---|
| Open | Milburn Michael A | $155,000 | |
| Previous Owner | Ellsworth Debra | $88,609 |
Source: Public Records
Tax History Compared to Growth
Tax History
| Year | Tax Paid | Tax Assessment Tax Assessment Total Assessment is a certain percentage of the fair market value that is determined by local assessors to be the total taxable value of land and additions on the property. | Land | Improvement |
|---|---|---|---|---|
| 2025 | $2,056 | $250,035 | $97,995 | $152,040 |
| 2024 | $2,056 | $198,048 | $44,100 | $153,948 |
| 2023 | $2,965 | $220,555 | $44,100 | $176,455 |
| 2022 | $3,089 | $183,934 | $33,264 | $150,670 |
| 2021 | $3,008 | $160,963 | $33,264 | $127,699 |
| 2020 | $2,877 | $149,085 | $33,264 | $115,821 |
| 2019 | $2,692 | $134,949 | $25,200 | $109,749 |
| 2018 | $2,469 | $124,517 | $25,200 | $99,317 |
| 2017 | $2,183 | $124,517 | $25,200 | $99,317 |
| 2016 | $2,107 | $120,196 | $25,200 | $94,996 |
| 2015 | $1,945 | $116,282 | $25,200 | $91,082 |
| 2014 | $1,945 | $111,581 | $25,200 | $86,381 |
Source: Public Records
Map
Nearby Homes
- 5906 Mesquite Dr
- 6223 Mesquite Dr
- 6039 Pine Cone Ln
- 6015 Pine Cone Ln
- 5905 Havens Trail
- 5841 Havens Trail
- 6136 Graemont Blvd
- 3123 Oak Bend
- 5803 Persimmon Dr
- 5718 Gloucester Dr
- 3114 Arbor Oak Dr
- 5401 Andover Dr
- 5623 Berkeley Dr
- 3110 Tallow Oak Cir
- 5832 Mustang Trail
- 5793 Palo Pinto Dr
- 5415 Andover Dr
- 5527 Andover Dr
- 2015 Dressage Ln
- 2020 Equestrian Ln
- 6039 6039 Whispering Ln
- 6051 Whispering Ln
- 6027 6027 Whispering Ln
- 6027 Whispering Ln
- 6038 Mesquite Dr
- 6050 Mesquite Dr
- 6026 Mesquite Dr
- 6038 Whispering Ln
- 6015 Whispering Ln
- 6050 Whispering Ln
- 6026 Whispering Ln
- 6015 6015 Whispering Ln
- 6113 Whispering Ln
- 6014 Mesquite Dr
- 6112 Mesquite Dr
- 6112 6112 Whispering Ln
- 6112 6112 Mesquite Dr
- 6112 Whispering Ln
- 6039 6039 Mesquite Dr
- 6125 6125 Whispering Ln