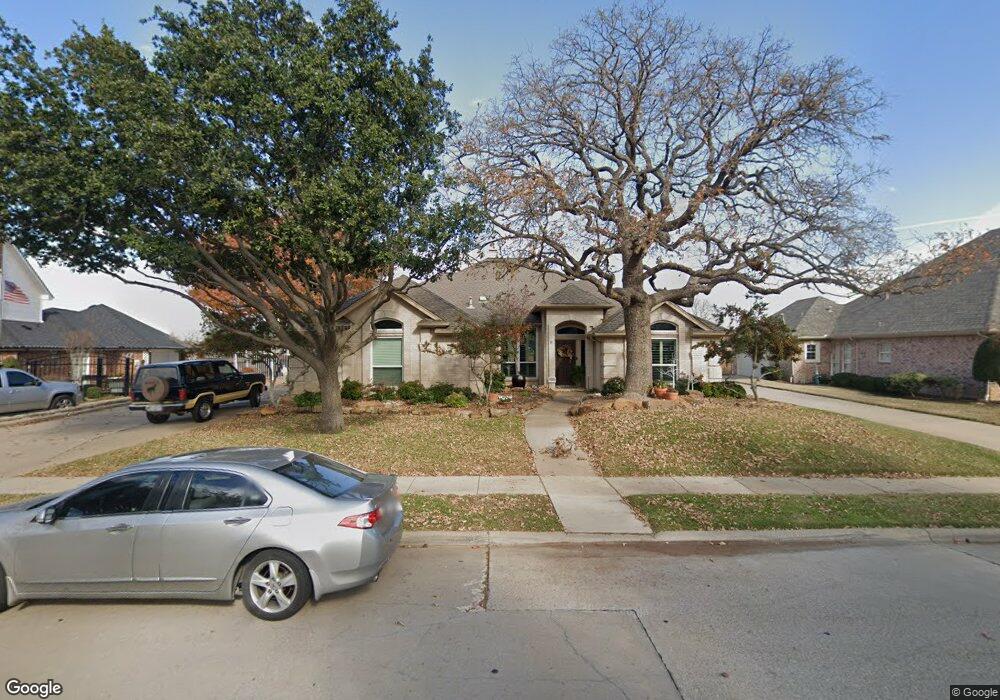
604 Bridlewood N Colleyville, TX 76034
Estimated Value: $655,000 - $731,000
4
Beds
3
Baths
2,612
Sq Ft
$263/Sq Ft
Est. Value
About This Home
This home is located at 604 Bridlewood N, Colleyville, TX 76034 and is currently estimated at $687,136, approximately $263 per square foot. 604 Bridlewood N is a home located in Tarrant County with nearby schools including Bransford Elementary School, Colleyville Middle School, and Grapevine High School.
Ownership History
Date
Name
Owned For
Owner Type
Purchase Details
Closed on
Feb 20, 2001
Sold by
Saalfrank David C and Saalfrank Andrea Tracy
Bought by
Montes Louis and Montes Teresa
Current Estimated Value
Home Financials for this Owner
Home Financials are based on the most recent Mortgage that was taken out on this home.
Original Mortgage
$192,000
Outstanding Balance
$68,159
Interest Rate
6.85%
Estimated Equity
$618,977
Purchase Details
Closed on
Feb 13, 1996
Sold by
P & S Construction Co
Bought by
Saalfrank David C and Saalfrank Andrea Tracy
Home Financials for this Owner
Home Financials are based on the most recent Mortgage that was taken out on this home.
Original Mortgage
$141,300
Interest Rate
7.04%
Create a Home Valuation Report for This Property
The Home Valuation Report is an in-depth analysis detailing your home's value as well as a comparison with similar homes in the area
Home Values in the Area
Average Home Value in this Area
Purchase History
| Date | Buyer | Sale Price | Title Company |
|---|---|---|---|
| Montes Louis | -- | Alamo Title Company | |
| Saalfrank David C | -- | American Title Company |
Source: Public Records
Mortgage History
| Date | Status | Borrower | Loan Amount |
|---|---|---|---|
| Open | Montes Louis | $192,000 | |
| Previous Owner | Saalfrank David C | $141,300 | |
| Closed | Saalfrank David C | $28,200 | |
| Closed | Montes Louis | $36,000 |
Source: Public Records
Tax History Compared to Growth
Tax History
| Year | Tax Paid | Tax Assessment Tax Assessment Total Assessment is a certain percentage of the fair market value that is determined by local assessors to be the total taxable value of land and additions on the property. | Land | Improvement |
|---|---|---|---|---|
| 2025 | $1,750 | $628,892 | $115,300 | $513,592 |
| 2024 | $1,750 | $628,892 | $115,300 | $513,592 |
| 2023 | $7,788 | $511,051 | $115,300 | $395,751 |
| 2022 | $8,289 | $467,540 | $115,300 | $352,240 |
| 2021 | $8,379 | $381,547 | $100,000 | $281,547 |
| 2020 | $8,478 | $381,547 | $100,000 | $281,547 |
| 2019 | $9,040 | $411,000 | $97,307 | $313,693 |
| 2018 | $2,113 | $355,450 | $90,000 | $265,450 |
| 2017 | $8,397 | $355,450 | $90,000 | $265,450 |
| 2016 | $7,897 | $354,457 | $90,000 | $264,457 |
| 2015 | $6,845 | $303,900 | $45,000 | $258,900 |
| 2014 | $6,845 | $303,900 | $45,000 | $258,900 |
Source: Public Records
Map
Nearby Homes
- 628 Huntwich Dr
- 4105 Inwood Ln
- 4600 Bransford Rd
- 909 Brestol Ct W
- 4600 Westbury Dr
- 405 Woodbriar Ct
- 4002 Copperwood Ct
- 4516 Dartmoore Ln
- 3907 Copperwood Ct
- 3624 Wayne Ct
- 3605 Spring Valley Dr
- 3609 Wayne Ct
- 1921 Maplewood Trail
- 1104 Garry Lynne Dr
- 312 Bremen Dr
- 114 Glade Rd
- 1109 Simpson Terrace
- 112 Glade Rd
- 1303 Crest Dr
- 3713 Brentwood Ct
- 608 Bridlewood N
- 600 Bridlewood N
- 600 Bridlewood N
- 603 Bridlewood N
- 612 Bridlewood N
- 512 Bridlewood N
- 4115 Coachman Ln
- 4106 Bridlewood Ct
- 4201 Green Meadow St E
- 4210 Green Meadow St W
- 4113 Coachman Ln
- 614 Bridlewood N
- 517 Waterford Ln
- 4203 Green Meadow St E
- 4212 Green Meadow St W
- 4104 Bridlewood Ct
- 4111 Coachman Ln
- 513 Waterford Ln
- 504 Bridlewood N
- 4114 Coachman Ln