Estimated Value: $236,000 - $281,000
3
Beds
2
Baths
1,218
Sq Ft
$209/Sq Ft
Est. Value
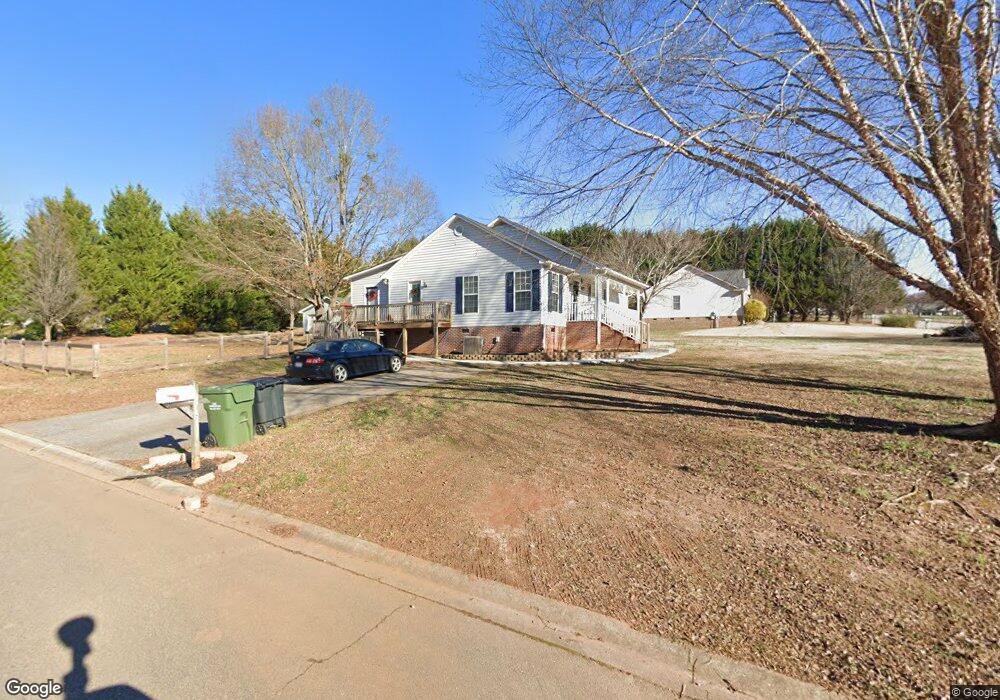
About This Home
This home is located at 604 Brimley Ct, Inman, SC 29349 and is currently estimated at $254,879, approximately $209 per square foot. 604 Brimley Ct is a home located in Spartanburg County with nearby schools including New Prospect Elementary School, T.E. Mabry Middle School, and Chapman High School.
Ownership History
Date
Name
Owned For
Owner Type
Purchase Details
Closed on
Oct 8, 2021
Sold by
Hicks May G and Hicks Donald T
Bought by
Hicks Amy C
Current Estimated Value
Home Financials for this Owner
Home Financials are based on the most recent Mortgage that was taken out on this home.
Original Mortgage
$170,940
Outstanding Balance
$155,977
Interest Rate
2.99%
Estimated Equity
$98,902
Purchase Details
Closed on
Jun 19, 2008
Sold by
The Bank Of New York Trust Co Na
Bought by
Hicks Donald T and Hicks Amy G
Home Financials for this Owner
Home Financials are based on the most recent Mortgage that was taken out on this home.
Original Mortgage
$67,920
Interest Rate
6.27%
Mortgage Type
Unknown
Purchase Details
Closed on
Apr 7, 2008
Sold by
Fortenberry William H
Bought by
The Bank Of New York Trust Co Na
Purchase Details
Closed on
May 7, 2003
Sold by
Jbc Builders
Bought by
Fortenberry William H
Create a Home Valuation Report for This Property
The Home Valuation Report is an in-depth analysis detailing your home's value as well as a comparison with similar homes in the area
Home Values in the Area
Average Home Value in this Area
Purchase History
| Date | Buyer | Sale Price | Title Company |
|---|---|---|---|
| Hicks Amy C | -- | None Available | |
| Hicks Amy C | -- | None Available | |
| Hicks Donald T | $84,900 | -- | |
| The Bank Of New York Trust Co Na | $97,750 | -- | |
| Fortenberry William H | $92,400 | -- |
Source: Public Records
Mortgage History
| Date | Status | Borrower | Loan Amount |
|---|---|---|---|
| Open | Hicks Amy C | $170,940 | |
| Closed | Hicks Amy C | $170,940 | |
| Closed | Hicks Donald T | $67,920 |
Source: Public Records
Tax History
| Year | Tax Paid | Tax Assessment Tax Assessment Total Assessment is a certain percentage of the fair market value that is determined by local assessors to be the total taxable value of land and additions on the property. | Land | Improvement |
|---|---|---|---|---|
| 2022 | $3,335 | $8,114 | $1,589 | $6,525 |
| 2021 | $978 | $5,409 | $1,059 | $4,350 |
| 2020 | $960 | $5,409 | $1,059 | $4,350 |
| 2019 | $960 | $5,409 | $1,059 | $4,350 |
| 2018 | $960 | $5,409 | $1,059 | $4,350 |
| 2017 | $842 | $4,704 | $1,000 | $3,704 |
| 2016 | $842 | $4,704 | $1,000 | $3,704 |
| 2015 | $837 | $4,704 | $1,000 | $3,704 |
| 2014 | $832 | $4,704 | $1,000 | $3,704 |
Source: Public Records
Map
Nearby Homes
- 461 Island Ford Rd
- 412 Rockcove Rd
- 383 Island Green Ln
- 132 Englewood Dr
- 5231 Highway 11
- 0 Fraley Dr
- 475 N Tidewater Trail
- 434 Tangleridge Dr
- 6005 Highway 11
- 208 E Caledonia Ct
- 825 E Heathland Dr
- 123 N Woodfin Ridge Dr
- 207 Suttles Rd
- 139 N Woodfin Ridge Dr
- 353 Fagan Dr
- 103 Alteza Dr
- 954 Tradition Ln
- 106 Alteza Dr
- 118 Alteza Dr
- 142 Alteza Dr
- 516 Wind Crest Dr
- 610 Brimley Ct
- 605 Brimley Ct
- 609 Brimley Ct
- 523 Wind Crest Dr
- 539 Wind Crest Dr
- 517 Wind Crest Dr
- 616 Brimley Ct
- 529 Wind Crest Dr
- 615 Brimley Ct
- 1455 Lake Bowen Dam Rd
- 1445 Lake Bowen Dam Rd
- 546 Wind Crest Dr
- 511 Wind Crest Dr
- 1465 Lake Bowen Dam Rd
- 541 Wind Crest Dr
- 621 Brimley Ct
- 535 Wind Crest Dr
- 626 Brimley Ct
- 1475 Lake Bowen Dam Rd
Your Personal Tour Guide
Ask me questions while you tour the home.