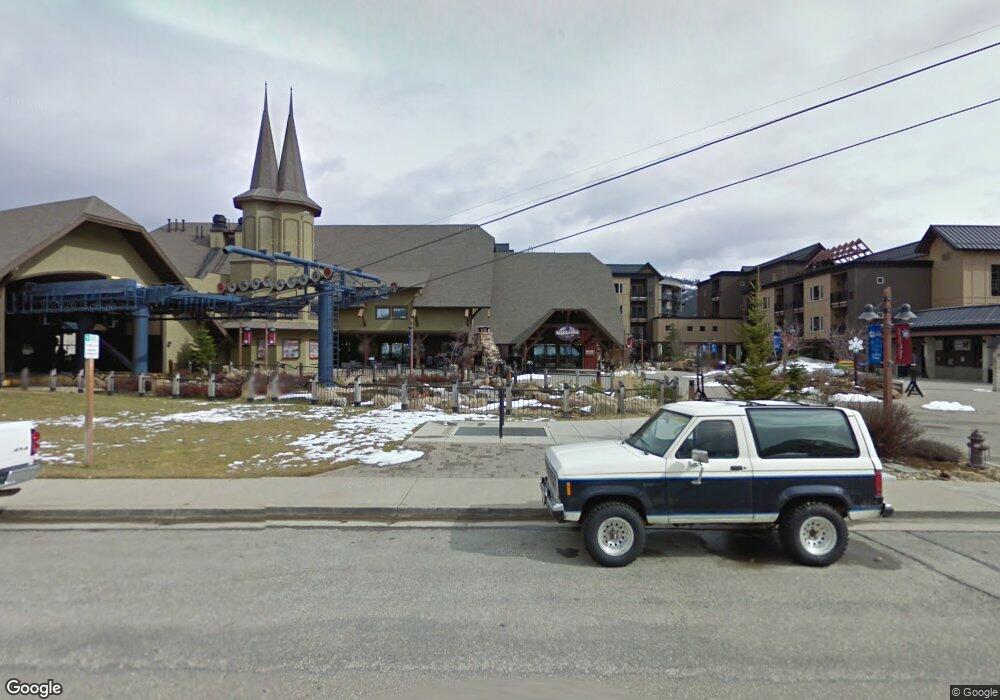
604 Bunker Ave Unit 203 Kellogg, ID 83837
Estimated Value: $164,982 - $181,000
Studio
1
Bath
312
Sq Ft
$554/Sq Ft
Est. Value
About This Home
This home is located at 604 Bunker Ave Unit 203, Kellogg, ID 83837 and is currently estimated at $172,746, approximately $553 per square foot. 604 Bunker Ave Unit 203 is a home located in Shoshone County with nearby schools including Pinehurst Elementary School, Kellogg Middle School, and Kellogg High School.
Ownership History
Date
Name
Owned For
Owner Type
Purchase Details
Closed on
May 21, 2025
Sold by
Water Works Properties Llc and Waterworks Llc
Bought by
Rojo Marco and Rojo Karla
Current Estimated Value
Home Financials for this Owner
Home Financials are based on the most recent Mortgage that was taken out on this home.
Original Mortgage
$117,000
Outstanding Balance
$98,590
Interest Rate
6.83%
Mortgage Type
Seller Take Back
Estimated Equity
$74,156
Purchase Details
Closed on
Jan 28, 2015
Sold by
Fannie Mae
Bought by
Water Works Properties Llc
Purchase Details
Closed on
Oct 6, 2005
Sold by
Silver Mountain Corp
Bought by
Ohnstad Richard W and Ohnstad Marilyn M
Home Financials for this Owner
Home Financials are based on the most recent Mortgage that was taken out on this home.
Original Mortgage
$92,720
Interest Rate
5.67%
Mortgage Type
New Conventional
Create a Home Valuation Report for This Property
The Home Valuation Report is an in-depth analysis detailing your home's value as well as a comparison with similar homes in the area
Home Values in the Area
Average Home Value in this Area
Purchase History
| Date | Buyer | Sale Price | Title Company |
|---|---|---|---|
| Rojo Marco | -- | Flying S Title And Escrow | |
| Water Works Properties Llc | -- | None Available | |
| Ohnstad Richard W | -- | -- |
Source: Public Records
Mortgage History
| Date | Status | Borrower | Loan Amount |
|---|---|---|---|
| Open | Rojo Marco | $117,000 | |
| Previous Owner | Ohnstad Richard W | $92,720 |
Source: Public Records
Tax History
| Year | Tax Paid | Tax Assessment Tax Assessment Total Assessment is a certain percentage of the fair market value that is determined by local assessors to be the total taxable value of land and additions on the property. | Land | Improvement |
|---|---|---|---|---|
| 2025 | $1,549 | $153,600 | $153,600 | $0 |
| 2024 | $1,627 | $153,600 | $153,600 | $0 |
| 2023 | $1,627 | $153,600 | $153,600 | $0 |
| 2022 | $1,705 | $128,000 | $128,000 | $0 |
| 2021 | $1,509 | $80,000 | $80,000 | $0 |
| 2020 | $1,543 | $80,000 | $80,000 | $0 |
| 2019 | $2,303 | $111,475 | $111,475 | $0 |
| 2018 | $1,925 | $79,625 | $79,625 | $0 |
| 2017 | $1,681 | $70,438 | $70,438 | $0 |
| 2016 | $1,515 | $61,250 | $61,250 | $0 |
| 2015 | -- | $61,250 | $61,250 | $0 |
| 2014 | -- | $34,727 | $34,727 | $0 |
Source: Public Records
Map
Nearby Homes
- 602 Bunker Ave Unit 222
- 602 Bunker Ave Unit 215
- 834 Mc Kinley Ave W Unit 403
- 834 Mc Kinley Ave W Unit 102
- 834 Mc Kinley Ave W Unit 404
- 834 Mc Kinley Ave W Unit 204
- 308 Ohio Ave Unit 105
- 308 Ohio Ave Unit 402
- 308 Ohio Ave Unit 205
- 834 Mckinley Ave Unit 201
- 607 W Riverside Ave
- 204 Chestnut St
- 140 Railroad Ave Units 1-5
- 140 Railroad Ave Unit 6
- 140 Railroad Ave Unit 5
- 140 Railroad Ave Unit 2
- 140 Railroad Ave Unit 4
- 140 Railroad Ave Unit 3
- 140 Railroad Ave Unit 1
- 303 W Mission Ave
- 604 Bunker Ave Unit 405
- 604 Bunker Ave Unit 412
- 604 Bunker Ave Unit 403
- 604 Bunker Ave Unit 7C
- 604 Bunker Ave Unit 7A
- 604 Bunker Ave Unit 7B
- 604 Bunker Ave Unit 502
- 604 Bunker Ave Unit 211
- 604 Bunker Ave Unit 201
- 604 Bunker Ave Unit 324
- 604 Bunker Ave Unit 311
- 604 Bunker Ave Unit 301
- 604 Bunker Ave Unit 208
- 604 Bunker Ave Unit 401-403
- 604 Bunker Ave
- 604 Bunker Ave Unit 401
- 604 Bunker Ave Unit 405
- 604 Bunker Ave Unit 304
- 604 Bunker Ave Unit 310
- 604 Bunker Ave Unit 8
Your Personal Tour Guide
Ask me questions while you tour the home.