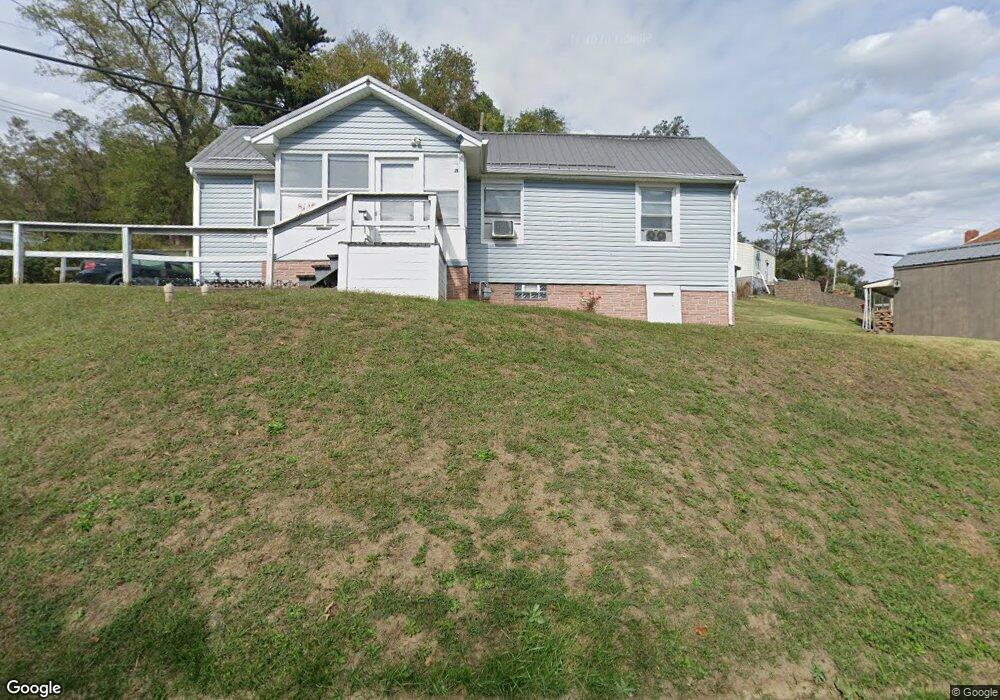
604 Columbus Ave Martins Ferry, OH 43935
Estimated Value: $66,000 - $118,000
2
Beds
1
Bath
968
Sq Ft
$91/Sq Ft
Est. Value
About This Home
This home is located at 604 Columbus Ave, Martins Ferry, OH 43935 and is currently estimated at $88,057, approximately $90 per square foot. 604 Columbus Ave is a home located in Belmont County with nearby schools including Anna Marie Ayers Elementary School, Martins Ferry Middle School, and Martins Ferry High School.
Ownership History
Date
Name
Owned For
Owner Type
Purchase Details
Closed on
Oct 21, 2005
Sold by
Hassinger James E
Bought by
Stoneking Benjamin R
Current Estimated Value
Home Financials for this Owner
Home Financials are based on the most recent Mortgage that was taken out on this home.
Original Mortgage
$44,900
Outstanding Balance
$28,825
Interest Rate
9.12%
Mortgage Type
Adjustable Rate Mortgage/ARM
Estimated Equity
$59,232
Purchase Details
Closed on
Jun 6, 2002
Sold by
Hassinger James E
Bought by
Hassinger James E
Purchase Details
Closed on
Jan 17, 2001
Bought by
Citizens Savings Bank
Purchase Details
Closed on
Aug 14, 1996
Sold by
Barcus Edsel N
Bought by
Barcus Edsel N
Purchase Details
Closed on
Jan 1, 1986
Sold by
Barcus Edsel and Barcus Fannie
Bought by
Barcus Edsel and Barcus Fannie
Create a Home Valuation Report for This Property
The Home Valuation Report is an in-depth analysis detailing your home's value as well as a comparison with similar homes in the area
Home Values in the Area
Average Home Value in this Area
Purchase History
| Date | Buyer | Sale Price | Title Company |
|---|---|---|---|
| Stoneking Benjamin R | $33,675 | Express Title Inc | |
| Hassinger James E | $14,000 | -- | |
| Citizens Savings Bank | $8,000 | -- | |
| Barcus Edsel N | $16,000 | -- | |
| Barcus Edsel | -- | -- |
Source: Public Records
Mortgage History
| Date | Status | Borrower | Loan Amount |
|---|---|---|---|
| Open | Stoneking Benjamin R | $44,900 |
Source: Public Records
Tax History Compared to Growth
Tax History
| Year | Tax Paid | Tax Assessment Tax Assessment Total Assessment is a certain percentage of the fair market value that is determined by local assessors to be the total taxable value of land and additions on the property. | Land | Improvement |
|---|---|---|---|---|
| 2024 | $1,006 | $24,490 | $2,470 | $22,020 |
| 2023 | $742 | $16,550 | $1,830 | $14,720 |
| 2022 | $742 | $16,551 | $1,827 | $14,724 |
| 2021 | $2,637 | $16,551 | $1,827 | $14,724 |
| 2020 | $1,594 | $14,400 | $1,590 | $12,810 |
| 2019 | $1,541 | $14,400 | $1,590 | $12,810 |
| 2018 | $881 | $14,400 | $1,590 | $12,810 |
| 2017 | $652 | $13,720 | $1,500 | $12,220 |
| 2016 | $657 | $13,720 | $1,500 | $12,220 |
| 2015 | $592 | $13,720 | $1,500 | $12,220 |
| 2014 | $567 | $12,990 | $1,360 | $11,630 |
| 2013 | $534 | $12,990 | $1,360 | $11,630 |
Source: Public Records
Map
Nearby Homes