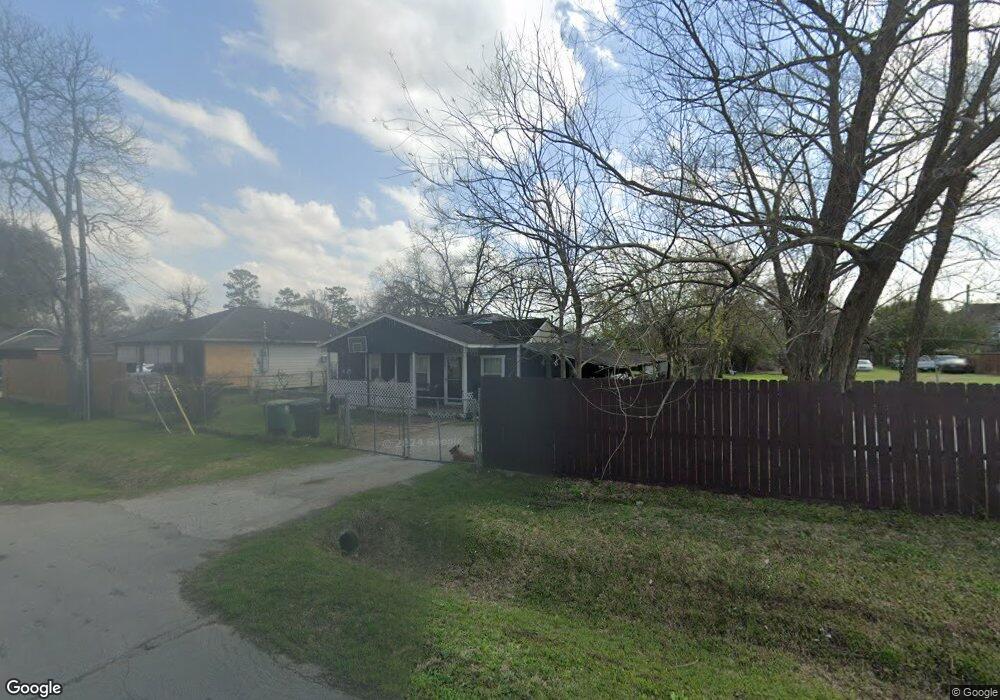
604 De Boll St Houston, TX 77022
Northside-Northline NeighborhoodEstimated Value: $174,546 - $257,000
3
Beds
1
Bath
1,026
Sq Ft
$218/Sq Ft
Est. Value
About This Home
This home is located at 604 De Boll St, Houston, TX 77022 and is currently estimated at $223,887, approximately $218 per square foot. 604 De Boll St is a home located in Harris County with nearby schools including Burbank Elementary School, Burbank Middle School, and Sam Houston Math, Science & Technology Center.
Ownership History
Date
Name
Owned For
Owner Type
Purchase Details
Closed on
May 11, 2001
Sold by
Cardenas Antonio and Cardenas Hermelinda
Bought by
Mena Juan R
Current Estimated Value
Home Financials for this Owner
Home Financials are based on the most recent Mortgage that was taken out on this home.
Original Mortgage
$56,050
Outstanding Balance
$20,867
Interest Rate
6.99%
Mortgage Type
Stand Alone First
Estimated Equity
$203,020
Purchase Details
Closed on
May 5, 1997
Sold by
Mccall Leon Ralph
Bought by
Cardenas Antonio and Cardenas Hermelinda
Create a Home Valuation Report for This Property
The Home Valuation Report is an in-depth analysis detailing your home's value as well as a comparison with similar homes in the area
Home Values in the Area
Average Home Value in this Area
Purchase History
| Date | Buyer | Sale Price | Title Company |
|---|---|---|---|
| Mena Juan R | -- | First American Title | |
| Cardenas Antonio | -- | -- |
Source: Public Records
Mortgage History
| Date | Status | Borrower | Loan Amount |
|---|---|---|---|
| Open | Mena Juan R | $56,050 |
Source: Public Records
Tax History Compared to Growth
Tax History
| Year | Tax Paid | Tax Assessment Tax Assessment Total Assessment is a certain percentage of the fair market value that is determined by local assessors to be the total taxable value of land and additions on the property. | Land | Improvement |
|---|---|---|---|---|
| 2025 | $1,275 | $157,248 | $108,931 | $48,317 |
| 2024 | $1,275 | $147,418 | $99,973 | $47,445 |
| 2023 | $1,275 | $135,042 | $60,915 | $74,127 |
| 2022 | $2,326 | $118,682 | $60,915 | $57,767 |
| 2021 | $2,238 | $102,982 | $60,915 | $42,067 |
| 2020 | $2,114 | $97,494 | $60,915 | $36,579 |
| 2019 | $2,008 | $88,900 | $50,166 | $38,734 |
| 2018 | $1,166 | $72,150 | $41,924 | $30,226 |
| 2017 | $1,784 | $72,150 | $41,924 | $30,226 |
| 2016 | $1,621 | $68,224 | $39,416 | $28,808 |
| 2015 | $1,026 | $58,298 | $28,666 | $29,632 |
| 2014 | $1,026 | $58,298 | $28,666 | $29,632 |
Source: Public Records
Map
Nearby Homes
- 9026 Mcgallion Rd
- 807 Firnat St
- 702 Pennington St
- 723 Doverside St
- 318 Charlock St
- 1207 Firnat St
- 88 Berry Rd
- 253 De Boll St
- 249 De Boll St
- 411 Berry Rd
- 216 Burress St
- 8411 Berry Brush Ln
- 8402 Berry Green Ln
- 802 Berry Sage Ln
- 8205 Appleton St
- 132 Grothe Ln
- 108 Fichter St
- 415 Briarcliff Dr
- 1104 Charnwood St
- 202 Burbank St