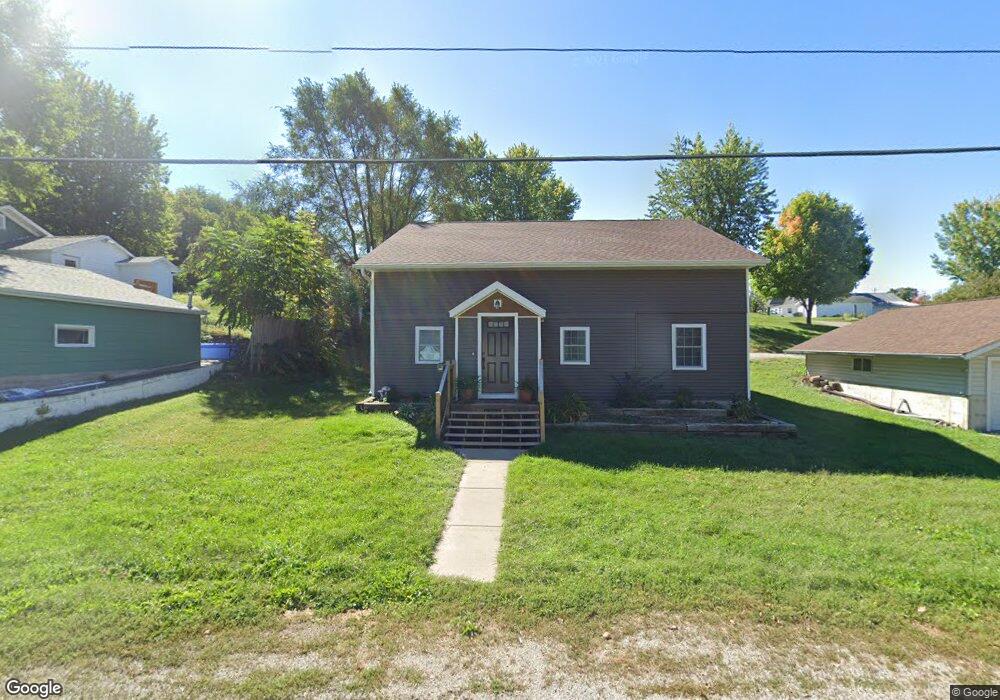
604 E 2nd St Vinton, IA 52349
Estimated Value: $187,404 - $274,000
3
Beds
3
Baths
1,447
Sq Ft
$148/Sq Ft
Est. Value
About This Home
This home is located at 604 E 2nd St, Vinton, IA 52349 and is currently estimated at $214,101, approximately $147 per square foot. 604 E 2nd St is a home located in Benton County with nearby schools including Tilford Elementary School, Vinton-Shellsburg Middle School, and Vinton-Shellsburg High School.
Ownership History
Date
Name
Owned For
Owner Type
Purchase Details
Closed on
Feb 23, 2012
Sold by
Blank Nancy D
Bought by
Bowen Timothy J and Bowen Whitney D
Current Estimated Value
Home Financials for this Owner
Home Financials are based on the most recent Mortgage that was taken out on this home.
Original Mortgage
$5,200
Outstanding Balance
$3,559
Interest Rate
3.87%
Mortgage Type
Future Advance Clause Open End Mortgage
Estimated Equity
$210,542
Purchase Details
Closed on
Jul 12, 2007
Sold by
Meadows Jerry L and Meadows Julia A
Bought by
Blank Vincent and Blank Nancy
Home Financials for this Owner
Home Financials are based on the most recent Mortgage that was taken out on this home.
Original Mortgage
$25,000
Interest Rate
6.42%
Mortgage Type
Purchase Money Mortgage
Create a Home Valuation Report for This Property
The Home Valuation Report is an in-depth analysis detailing your home's value as well as a comparison with similar homes in the area
Home Values in the Area
Average Home Value in this Area
Purchase History
We collect this data history from publicly available records. To have your information removed, we recommend requesting removal directly through your county’s website.
| Date | Buyer | Sale Price | Title Company |
|---|---|---|---|
| Bowen Timothy J | $56,000 | None Available | |
| Blank Vincent | $30,000 | None Available |
Source: Public Records
Mortgage History
We collect this data history from publicly available records. To have your information removed, we recommend requesting removal directly through your county’s website.
| Date | Status | Borrower | Loan Amount |
|---|---|---|---|
| Open | Bowen Timothy J | $5,200 | |
| Previous Owner | Blank Vincent | $25,000 |
Source: Public Records
Tax History
| Year | Tax Paid | Tax Assessment Tax Assessment Total Assessment is a certain percentage of the fair market value that is determined by local assessors to be the total taxable value of land and additions on the property. | Land | Improvement |
|---|---|---|---|---|
| 2025 | $3,132 | $194,400 | $15,400 | $179,000 |
| 2024 | $3,132 | $177,400 | $15,400 | $162,000 |
| 2023 | $2,886 | $177,400 | $15,400 | $162,000 |
| 2022 | $2,960 | $143,000 | $12,300 | $130,700 |
| 2021 | $2,960 | $143,000 | $12,300 | $130,700 |
| 2020 | $2,904 | $143,000 | $8,500 | $134,500 |
| 2019 | $2,676 | $143,000 | $8,500 | $134,500 |
| 2018 | $1,560 | $137,500 | $7,700 | $129,800 |
| 2017 | $1,560 | $73,300 | $7,700 | $65,600 |
| 2016 | $746 | $34,600 | $7,200 | $27,400 |
| 2015 | $746 | $34,600 | $7,200 | $27,400 |
| 2014 | $850 | $39,300 | $0 | $0 |
Source: Public Records
Map
Nearby Homes
Your Personal Tour Guide
Ask me questions while you tour the home.