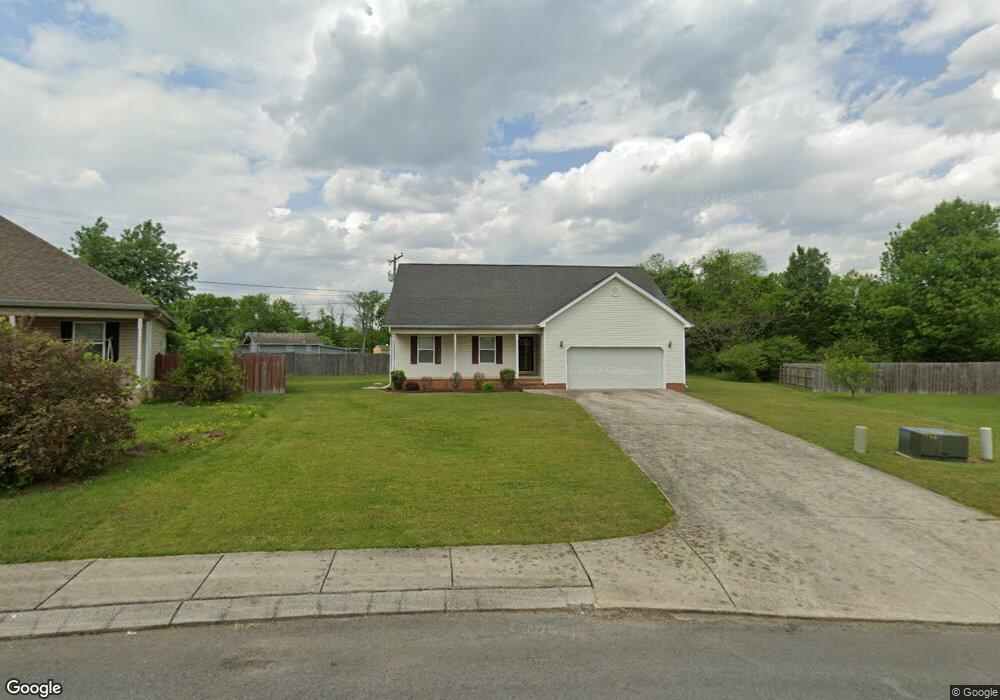
604 Florence St Rossville, GA 30741
Estimated Value: $200,000 - $240,995
--
Bed
2
Baths
1,710
Sq Ft
$130/Sq Ft
Est. Value
About This Home
This home is located at 604 Florence St, Rossville, GA 30741 and is currently estimated at $221,749, approximately $129 per square foot. 604 Florence St is a home located in Walker County with nearby schools including Rossville Elementary School, Rossville Middle School, and Ridgeland High School.
Ownership History
Date
Name
Owned For
Owner Type
Purchase Details
Closed on
May 22, 2023
Sold by
Beavers John Stanley
Bought by
Valazquez Destiny J and Beavers Jeremy L
Current Estimated Value
Purchase Details
Closed on
Jan 4, 2000
Sold by
Beavers John Stanley and Beavers Beverly
Bought by
Beavers John Stanley
Purchase Details
Closed on
Apr 28, 1998
Sold by
White Emma D and White Beverly B
Bought by
Beavers John Stanley and Beavers Beverly
Purchase Details
Closed on
Feb 10, 1995
Sold by
Beavers John Stanley
Bought by
White Emma D and Parks Emma E
Purchase Details
Closed on
Jan 27, 1988
Sold by
Beavers John and Beavers Donna A
Bought by
Beavers John Stanley
Purchase Details
Closed on
Mar 21, 1985
Sold by
Valley Fidelity Bank & Trust C
Bought by
Beavers John and Beavers Donna A
Purchase Details
Closed on
Feb 2, 1984
Sold by
Secretary Of Housing & Urban D
Bought by
Valley Fidelity Bank & Trust C
Purchase Details
Closed on
Jul 11, 1983
Bought by
Secretary Of Housing & Urban D
Create a Home Valuation Report for This Property
The Home Valuation Report is an in-depth analysis detailing your home's value as well as a comparison with similar homes in the area
Home Values in the Area
Average Home Value in this Area
Purchase History
| Date | Buyer | Sale Price | Title Company |
|---|---|---|---|
| Valazquez Destiny J | -- | -- | |
| Beavers John Stanley | -- | -- | |
| Beavers John Stanley | $29,500 | -- | |
| White Emma D | -- | -- | |
| White Emma D | -- | -- | |
| Beavers John Stanley | -- | -- | |
| Beavers John | $7,000 | -- | |
| Valley Fidelity Bank & Trust C | -- | -- | |
| Secretary Of Housing & Urban D | -- | -- |
Source: Public Records
Tax History Compared to Growth
Tax History
| Year | Tax Paid | Tax Assessment Tax Assessment Total Assessment is a certain percentage of the fair market value that is determined by local assessors to be the total taxable value of land and additions on the property. | Land | Improvement |
|---|---|---|---|---|
| 2024 | $2,153 | $65,947 | $3,669 | $62,278 |
| 2023 | $1,885 | $62,544 | $3,344 | $59,200 |
| 2022 | $1,239 | $54,789 | $3,344 | $51,445 |
| 2021 | $972 | $35,088 | $3,344 | $31,744 |
| 2020 | $891 | $31,034 | $3,344 | $27,690 |
| 2019 | $891 | $31,034 | $3,344 | $27,690 |
| 2018 | $923 | $31,034 | $3,344 | $27,690 |
| 2017 | $973 | $31,034 | $3,344 | $27,690 |
| 2016 | $800 | $31,034 | $3,344 | $27,690 |
| 2015 | $1,265 | $45,725 | $3,840 | $41,885 |
| 2014 | $1,218 | $45,725 | $3,840 | $41,885 |
| 2013 | -- | $45,725 | $3,840 | $41,885 |
Source: Public Records
Map
Nearby Homes
- 527 W Gordon Ave
- 509 W Gordon Ave
- 1410 E 50th St
- 1403 E 49th St
- 1405 E 49th St
- 200 W Oak St
- 53 Charlsie Trail Unit 12
- 816 Indian Ave
- 1014 Wilson Rd
- 916 Logan Ave
- 1604 E 46th Street Place
- 1014 Lee Ave
- 1614 E 47th St
- 806 Mcfarland Ave
- 1515 E 50th St
- 115 Beech St
- 2710 E 46th St
- 4908 13th Ave
- 635 N Sherry Dr
- 3312 E 51st St
- 479 Glenn Wade Dr
- 120 Florence St Unit 1 & 2
- 120 Florence St
- 120 Florence St Unit 1
- 122 Florence St
- 491 Glenn Wade Dr
- 120 Unit1 Florence St
- 473 Glenn Wade Dr
- 465 Glenn Wade Dr
- 114 Florence St
- 497 Glenn Wade Dr
- 472 Glenn Wade Dr
- 451 Glenn Wade Dr
- 464 Glenn Wade Dr
- 508 Florence St
- 0 Florence St Unit 1220171
- 0 Florence St Unit 1 & 2
- 123 Florence St
- 123 Florence St
- 509 Glenn Wade Dr