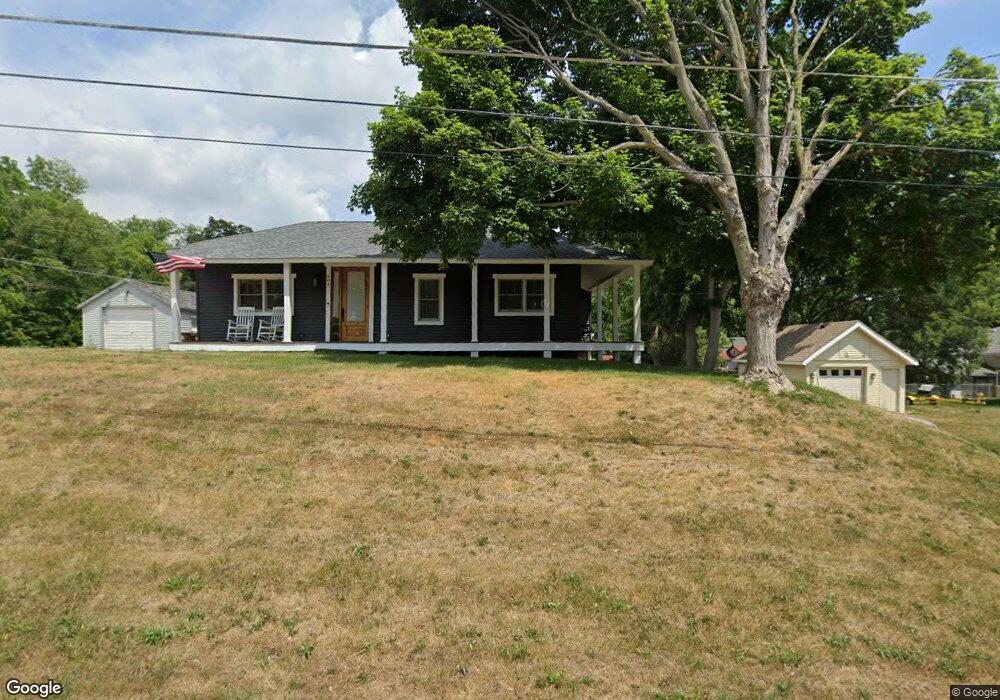
604 Franklin St Oregon, IL 61061
Estimated Value: $120,000 - $178,000
2
Beds
2
Baths
1,400
Sq Ft
$102/Sq Ft
Est. Value
About This Home
This home is located at 604 Franklin St, Oregon, IL 61061 and is currently estimated at $143,333, approximately $102 per square foot. 604 Franklin St is a home located in Ogle County with nearby schools including Oregon Elementary School and Oregon High School.
Ownership History
Date
Name
Owned For
Owner Type
Purchase Details
Closed on
Apr 21, 2020
Sold by
Hughes Weston D and Hughes Janie L
Bought by
Holland Gina A
Current Estimated Value
Home Financials for this Owner
Home Financials are based on the most recent Mortgage that was taken out on this home.
Original Mortgage
$297,000
Outstanding Balance
$262,606
Interest Rate
3.3%
Mortgage Type
New Conventional
Estimated Equity
-$119,273
Purchase Details
Closed on
Feb 19, 2018
Sold by
Hughes Hughes J and Hughes Weston D
Bought by
Hughes Weston D and Huthes Janie L
Create a Home Valuation Report for This Property
The Home Valuation Report is an in-depth analysis detailing your home's value as well as a comparison with similar homes in the area
Home Values in the Area
Average Home Value in this Area
Purchase History
| Date | Buyer | Sale Price | Title Company |
|---|---|---|---|
| Holland Gina A | $50,000 | None Available | |
| Hughes Weston D | -- | -- |
Source: Public Records
Mortgage History
| Date | Status | Borrower | Loan Amount |
|---|---|---|---|
| Open | Holland Gina A | $297,000 |
Source: Public Records
Tax History
| Year | Tax Paid | Tax Assessment Tax Assessment Total Assessment is a certain percentage of the fair market value that is determined by local assessors to be the total taxable value of land and additions on the property. | Land | Improvement |
|---|---|---|---|---|
| 2024 | $2,830 | $28,170 | $7,620 | $20,550 |
| 2023 | $2,482 | $24,902 | $6,502 | $18,400 |
| 2022 | $2,377 | $23,049 | $6,018 | $17,031 |
| 2021 | $2,242 | $21,507 | $5,615 | $15,892 |
| 2020 | $2,170 | $20,553 | $5,366 | $15,187 |
| 2019 | $2,800 | $32,656 | $5,339 | $27,317 |
| 2018 | $3,259 | $31,250 | $5,109 | $26,141 |
| 2017 | $3,245 | $31,250 | $5,109 | $26,141 |
| 2016 | $3,104 | $30,155 | $4,930 | $25,225 |
| 2015 | $3,056 | $31,217 | $5,104 | $26,113 |
| 2014 | $3,069 | $31,217 | $5,104 | $26,113 |
| 2013 | $3,050 | $32,770 | $5,358 | $27,412 |
Source: Public Records
Map
Nearby Homes
- 709 Franklin St
- 213 N 4th St
- 304 N 4th St
- 400 N 4th St
- 400 Lillemor Ln
- 404 Lillemor Ln
- 405 Lillemor Ln
- 410 Lillemor Ln
- 980 Illinois St
- 990 Illinois St
- 1000 Illinois St
- 207 S 1st St
- 000 S Anterior Rd
- 202 N Etnyre Ave
- 510 E Washington St
- 111 N Nohe Ave
- 1011 S 3rd St
- 1107 S 2nd St
- 959 N River Rd
- 000 Woods Dr
Your Personal Tour Guide
Ask me questions while you tour the home.