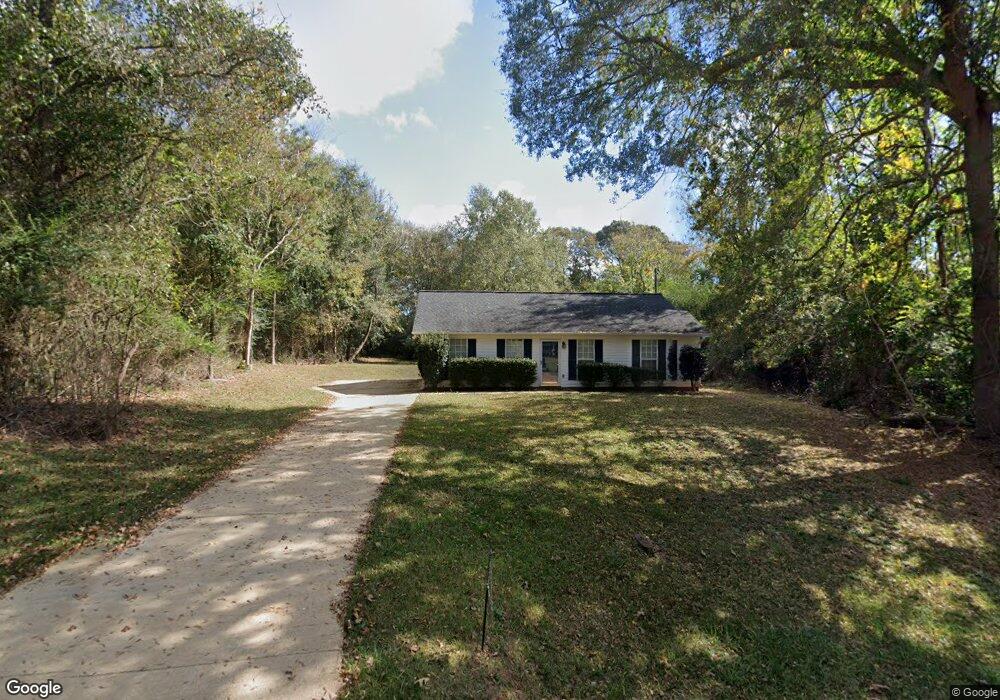
604 Hudson Rd Lagrange, GA 30240
Estimated Value: $160,231 - $203,000
3
Beds
2
Baths
1,040
Sq Ft
$178/Sq Ft
Est. Value
About This Home
This home is located at 604 Hudson Rd, Lagrange, GA 30240 and is currently estimated at $184,808, approximately $177 per square foot. 604 Hudson Rd is a home located in Troup County with nearby schools including Long Cane Elementary School, Berta Weathersbee Elementary School, and Whitesville Road Elementary School.
Ownership History
Date
Name
Owned For
Owner Type
Purchase Details
Closed on
Apr 21, 2016
Sold by
Rice Patricia
Bought by
Estes Bowman
Current Estimated Value
Home Financials for this Owner
Home Financials are based on the most recent Mortgage that was taken out on this home.
Original Mortgage
$91,471
Outstanding Balance
$72,148
Interest Rate
3.71%
Mortgage Type
New Conventional
Estimated Equity
$112,660
Purchase Details
Closed on
Oct 2, 2001
Sold by
Upchurch Robert T and Upchurch Joel C
Bought by
Rice Patricia
Purchase Details
Closed on
Apr 27, 2001
Sold by
Davis Ralph and Davis Irma R
Bought by
Upchurch Robert T and Upchurch Joel C
Purchase Details
Closed on
Mar 16, 1974
Sold by
Gillespie Gillespie J and Gillespie Margaret L
Bought by
Davis Ralph and Davis Irma R
Purchase Details
Closed on
Mar 27, 1951
Sold by
Williamson E L
Bought by
Gillespie Gillespie J and Gillespie Margaret L
Create a Home Valuation Report for This Property
The Home Valuation Report is an in-depth analysis detailing your home's value as well as a comparison with similar homes in the area
Purchase History
| Date | Buyer | Sale Price | Title Company |
|---|---|---|---|
| Estes Bowman | $94,300 | -- | |
| Rice Patricia | $84,500 | -- | |
| Upchurch Robert T | $9,500 | -- | |
| Davis Ralph | -- | -- | |
| Gillespie Gillespie J | -- | -- |
Source: Public Records
Mortgage History
| Date | Status | Borrower | Loan Amount |
|---|---|---|---|
| Open | Estes Bowman | $91,471 |
Source: Public Records
Tax History
| Year | Tax Paid | Tax Assessment Tax Assessment Total Assessment is a certain percentage of the fair market value that is determined by local assessors to be the total taxable value of land and additions on the property. | Land | Improvement |
|---|---|---|---|---|
| 2025 | $448 | $48,216 | $4,120 | $44,096 |
| 2024 | $311 | $40,464 | $4,120 | $36,344 |
| 2023 | $259 | $36,004 | $4,120 | $31,884 |
| 2022 | $950 | $34,044 | $4,120 | $29,924 |
| 2021 | $1,041 | $34,524 | $3,280 | $31,244 |
| 2020 | $978 | $32,424 | $3,700 | $28,724 |
| 2019 | $971 | $32,196 | $3,700 | $28,496 |
| 2018 | $891 | $29,544 | $3,700 | $25,844 |
| 2017 | $891 | $29,544 | $3,700 | $25,844 |
| 2016 | $650 | $23,547 | $3,700 | $19,847 |
| 2015 | $652 | $23,547 | $3,700 | $19,847 |
| 2014 | $621 | $22,502 | $3,700 | $18,802 |
| 2013 | -- | $24,031 | $3,700 | $20,331 |
Source: Public Records
Map
Nearby Homes
- 640 Hudson Rd
- 266 Glass Bridge Rd
- 0 Glass Bridge Rd Unit 10679358
- 119 Plymouth Dr
- 112 Foxdale Dr
- 113 Colonial Ct Unit 100
- 311 Cumberland Dr
- 105 Redwood Dr
- 124 Lincoln Ln
- 101 Ivy Springs Dr
- 808 S Fling Rd
- 135 Planters Ridge Dr
- 474 Newton Rd
- 509 Connie Dr
- 40 River Point Dr
- 22 Freeman Rd
- 427 Fling Rd
- 8 Horace Carter Rd
- 0 Bradfield Dr Unit 10568803
- 2239 Pegasus Pkwy
- 0 Hidden Springs Dr Unit 5 7556228
- 0 Hudson Rd Unit 8265141
- 0 Hudson Rd Unit 8265109
- 0 Hudson Rd Unit 8265105
- 0 Hudson Rd Unit 8496642
- 0 Hudson Rd Unit 8496640
- 0 Hudson Rd Unit 8496638
- 638 Hudson Rd
- 640 & 642 Hudson Rd
- 3744 W Point Rd
- 3744 West Point Rd
- 636 Hudson Rd
- 3728 West Point Rd
- 647 Hudson Rd
- 586 Hudson Rd
- 657 Hudson Rd
- 634 Hudson Rd
- 635 Hudson Rd
- 629 Hudson Rd
- 3706 West Point Rd
Your Personal Tour Guide
Ask me questions while you tour the home.