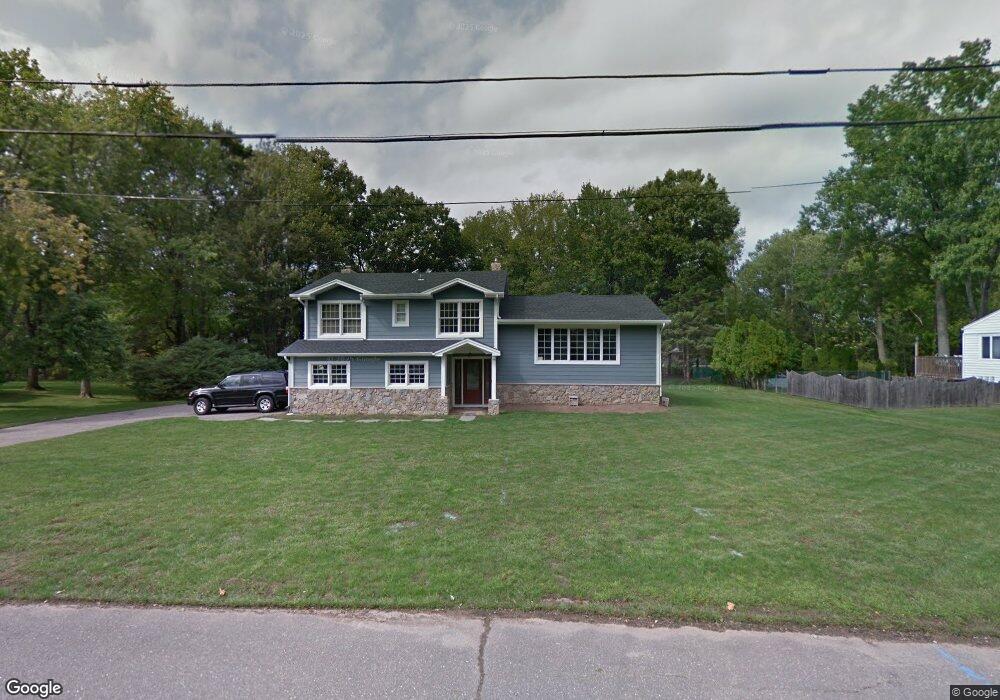
604 Lynn St Harrington Park, NJ 07640
Estimated Value: $1,153,000
--
Bed
--
Bath
1,768
Sq Ft
$652/Sq Ft
Est. Value
About This Home
This home is located at 604 Lynn St, Harrington Park, NJ 07640 and is currently estimated at $1,153,000, approximately $652 per square foot. 604 Lynn St is a home located in Bergen County with nearby schools including Harrington Park Elementary School and Northern Valley Regional High School at Old Tappan.
Ownership History
Date
Name
Owned For
Owner Type
Purchase Details
Closed on
Apr 8, 2013
Sold by
Birnie John F and Birnie Kristine A
Bought by
Redacted Upon Request
Current Estimated Value
Purchase Details
Closed on
Oct 29, 2007
Sold by
Shortal Robert G and Shortal Robert G
Home Financials for this Owner
Home Financials are based on the most recent Mortgage that was taken out on this home.
Original Mortgage
$417,000
Interest Rate
6.47%
Mortgage Type
New Conventional
Purchase Details
Closed on
Aug 8, 2000
Sold by
Shortal Robert G and Shortal Jacqueline G
Bought by
Shortal Robert G
Create a Home Valuation Report for This Property
The Home Valuation Report is an in-depth analysis detailing your home's value as well as a comparison with similar homes in the area
Home Values in the Area
Average Home Value in this Area
Purchase History
| Date | Buyer | Sale Price | Title Company |
|---|---|---|---|
| Redacted Upon Request | -- | None Listed On Document | |
| -- | $600,000 | -- | |
| Shortal Robert G | -- | -- |
Source: Public Records
Mortgage History
| Date | Status | Borrower | Loan Amount |
|---|---|---|---|
| Previous Owner | -- | $417,000 |
Source: Public Records
Tax History Compared to Growth
Tax History
| Year | Tax Paid | Tax Assessment Tax Assessment Total Assessment is a certain percentage of the fair market value that is determined by local assessors to be the total taxable value of land and additions on the property. | Land | Improvement |
|---|---|---|---|---|
| 2025 | $17,508 | $559,900 | $272,600 | $287,300 |
| 2024 | $16,971 | $559,900 | $272,600 | $287,300 |
| 2023 | $16,691 | $559,900 | $272,600 | $287,300 |
| 2022 | $16,691 | $559,900 | $272,600 | $287,300 |
| 2021 | $16,573 | $559,900 | $272,600 | $287,300 |
| 2020 | $16,500 | $559,900 | $272,600 | $287,300 |
| 2019 | $16,153 | $559,900 | $272,600 | $287,300 |
| 2018 | $15,856 | $559,900 | $272,600 | $287,300 |
| 2017 | $15,688 | $559,900 | $272,600 | $287,300 |
| 2016 | $15,240 | $559,900 | $272,600 | $287,300 |
| 2015 | $14,860 | $559,900 | $272,600 | $287,300 |
| 2014 | $14,518 | $559,900 | $272,600 | $287,300 |
Source: Public Records
Map
Nearby Homes