Estimated Value: $366,382 - $422,000
4
Beds
2
Baths
2,274
Sq Ft
$176/Sq Ft
Est. Value
About This Home
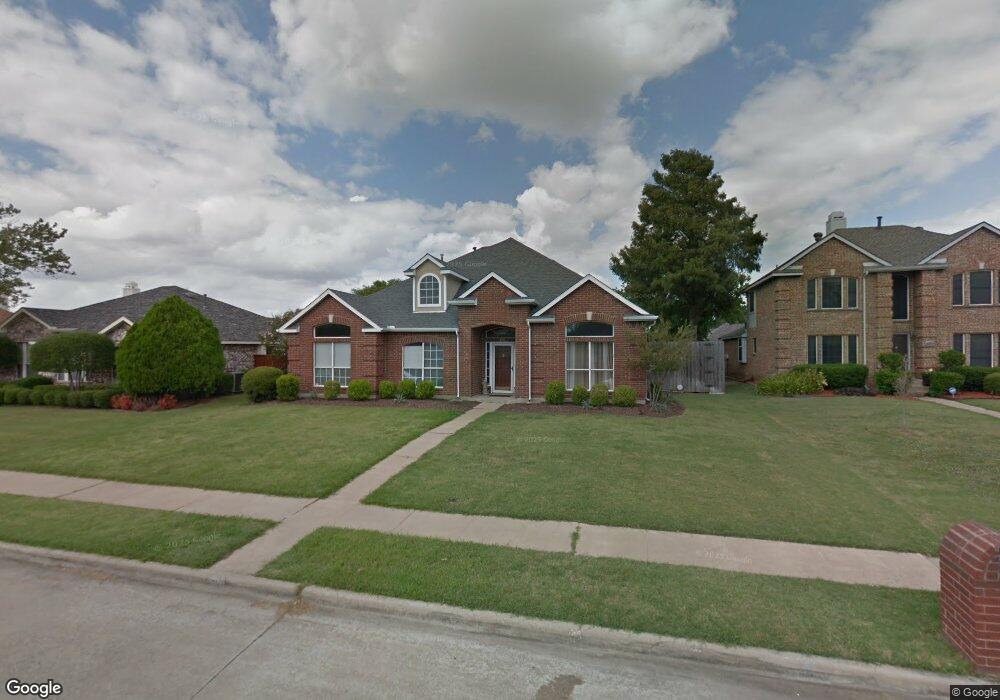
This home is located at 604 Nickelville Ln, Wylie, TX 75098 and is currently estimated at $400,096, approximately $175 per square foot. 604 Nickelville Ln is a home located in Collin County with nearby schools including T.F. Birmingham Elementary School, Frank Mcmillan Junior High School, and Davis Intermediate School.
Ownership History
Date
Name
Owned For
Owner Type
Purchase Details
Closed on
Feb 28, 2015
Sold by
Acosta Ramon E
Bought by
Colon Angela
Current Estimated Value
Purchase Details
Closed on
Sep 25, 2013
Sold by
Boradrick Chris L and Broadrick Margaret
Bought by
Colon Angela
Home Financials for this Owner
Home Financials are based on the most recent Mortgage that was taken out on this home.
Original Mortgage
$152,093
Interest Rate
4.75%
Mortgage Type
FHA
Purchase Details
Closed on
Aug 26, 2005
Sold by
Prudhomme Roger L
Bought by
Broadrick Chris L and Broadrick Margaret
Home Financials for this Owner
Home Financials are based on the most recent Mortgage that was taken out on this home.
Original Mortgage
$158,565
Interest Rate
5.81%
Mortgage Type
VA
Create a Home Valuation Report for This Property
The Home Valuation Report is an in-depth analysis detailing your home's value as well as a comparison with similar homes in the area
Home Values in the Area
Average Home Value in this Area
Purchase History
| Date | Buyer | Sale Price | Title Company |
|---|---|---|---|
| Colon Angela | -- | None Available | |
| Colon Angela | -- | Nat | |
| Broadrick Chris L | -- | -- |
Source: Public Records
Mortgage History
| Date | Status | Borrower | Loan Amount |
|---|---|---|---|
| Previous Owner | Colon Angela | $152,093 | |
| Previous Owner | Broadrick Chris L | $158,565 |
Source: Public Records
Tax History Compared to Growth
Tax History
| Year | Tax Paid | Tax Assessment Tax Assessment Total Assessment is a certain percentage of the fair market value that is determined by local assessors to be the total taxable value of land and additions on the property. | Land | Improvement |
|---|---|---|---|---|
| 2025 | $5,221 | $363,000 | $109,250 | $351,135 |
| 2024 | $5,221 | $330,000 | $95,000 | $269,000 |
| 2023 | $5,221 | $300,000 | $85,000 | $215,000 |
| 2022 | $5,985 | $272,800 | $85,000 | $250,293 |
| 2021 | $5,835 | $248,000 | $70,000 | $178,000 |
| 2020 | $6,303 | $257,708 | $55,000 | $202,708 |
| 2019 | $6,065 | $230,782 | $55,000 | $210,488 |
| 2018 | $5,650 | $209,802 | $55,000 | $185,871 |
| 2017 | $5,136 | $211,313 | $50,000 | $161,313 |
| 2016 | $4,818 | $199,235 | $40,000 | $159,235 |
| 2015 | $3,801 | $176,918 | $35,000 | $141,918 |
| 2014 | $3,801 | $143,297 | $0 | $0 |
Source: Public Records
Map
Nearby Homes
- 115 Pullman Place
- 708 Andersonville Ln
- 107 N Winding Oaks Dr
- 420 W Oak St
- 410 Oxford Dr
- 310 Austin Ave
- 404 W Jefferson St
- 314 Stephanie St
- 315 Celia Cir
- 913 Chickesaw Ln
- 307 W Brown St
- 907 Carlton Rd
- 410 N Winding Oaks Dr
- 309 Sikorsky Ct
- 111 N Keefer Dr
- 423 N Winding Oaks Dr
- 205 S Cottonbelt Ave
- 902 Greene Way
- 908 Greene Way
- 300 S Cottonbelt Ave Unit 3A
- 606 Nickelville Ln
- 602 Nickelville Ln
- 608 Nickelville Ln
- 203 N Carriage House Way
- 118 Pullman Place
- 601 Gateway Bend
- 201 N Carriage House Way
- 610 Nickelville Ln
- 725 W Brown St
- 603 Gateway Bend
- 116 Pullman Place
- 117 N Carriage House Way
- 202 N Carriage House Way
- 204 N Carriage House Way
- 612 Nickelville Ln
- 117 Pullman Place
- 605 Gateway Bend
- 200 N Carriage House Way
- 114 Pullman Place
- 205 N Carriage House Way