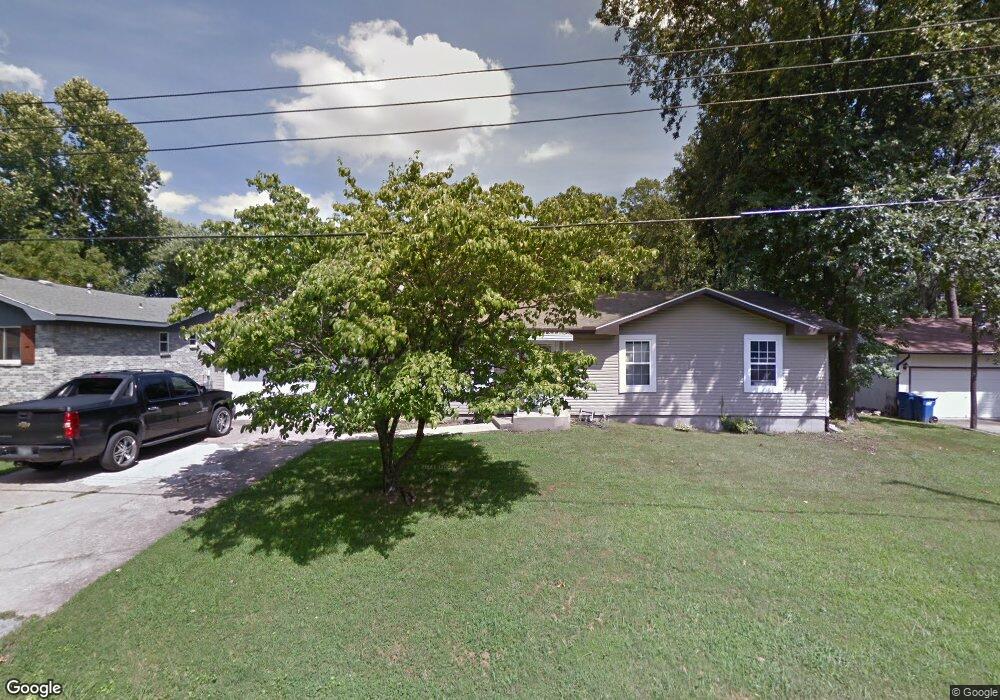
604 NW J St Bentonville, AR 72712
Estimated Value: $412,000 - $484,103
3
Beds
2
Baths
1,600
Sq Ft
$280/Sq Ft
Est. Value
About This Home
This home is located at 604 NW J St, Bentonville, AR 72712 and is currently estimated at $448,276, approximately $280 per square foot. 604 NW J St is a home located in Benton County with nearby schools including Thomas Jefferson Elementary School, Lincoln Junior High School, and Ardis Ann Middle School.
Ownership History
Date
Name
Owned For
Owner Type
Purchase Details
Closed on
Apr 28, 2010
Sold by
Hendrix Wallace and Hendrix Karen
Bought by
Ellzey Suzanne S
Current Estimated Value
Home Financials for this Owner
Home Financials are based on the most recent Mortgage that was taken out on this home.
Original Mortgage
$110,160
Outstanding Balance
$73,443
Interest Rate
5.02%
Mortgage Type
New Conventional
Estimated Equity
$374,833
Purchase Details
Closed on
Mar 5, 2010
Sold by
Jordan Mark
Bought by
Hendrix Wallace and Humphrey Leslie
Home Financials for this Owner
Home Financials are based on the most recent Mortgage that was taken out on this home.
Original Mortgage
$110,160
Outstanding Balance
$73,443
Interest Rate
5.02%
Mortgage Type
New Conventional
Estimated Equity
$374,833
Purchase Details
Closed on
Sep 25, 2003
Bought by
Dod Dod 9 and Dod 25
Purchase Details
Closed on
Sep 13, 1978
Bought by
Satterlee
Create a Home Valuation Report for This Property
The Home Valuation Report is an in-depth analysis detailing your home's value as well as a comparison with similar homes in the area
Home Values in the Area
Average Home Value in this Area
Purchase History
| Date | Buyer | Sale Price | Title Company |
|---|---|---|---|
| Ellzey Suzanne S | $108,000 | None Available | |
| Hendrix Wallace | $40,000 | Triad Title Company | |
| Dod Dod 9 | -- | -- | |
| Satterlee | -- | -- |
Source: Public Records
Mortgage History
| Date | Status | Borrower | Loan Amount |
|---|---|---|---|
| Open | Ellzey Suzanne S | $110,160 |
Source: Public Records
Tax History Compared to Growth
Tax History
| Year | Tax Paid | Tax Assessment Tax Assessment Total Assessment is a certain percentage of the fair market value that is determined by local assessors to be the total taxable value of land and additions on the property. | Land | Improvement |
|---|---|---|---|---|
| 2025 | $2,097 | $90,187 | $15,000 | $75,187 |
| 2024 | $2,010 | $90,187 | $15,000 | $75,187 |
| 2023 | $1,915 | $40,570 | $8,600 | $31,970 |
| 2022 | $1,501 | $40,570 | $8,600 | $31,970 |
| 2021 | $1,409 | $40,570 | $8,600 | $31,970 |
| 2020 | $1,340 | $26,930 | $3,800 | $23,130 |
| 2019 | $1,340 | $26,930 | $3,800 | $23,130 |
| 2018 | $1,362 | $26,930 | $3,800 | $23,130 |
| 2017 | $1,165 | $26,930 | $3,800 | $23,130 |
| 2016 | $1,165 | $26,930 | $3,800 | $23,130 |
| 2015 | $1,434 | $23,210 | $2,800 | $20,410 |
| 2014 | $1,084 | $23,210 | $2,800 | $20,410 |
Source: Public Records
Map
Nearby Homes