604 Otis Johnson Rd Pittsboro, NC 27312
Estimated Value: $355,070 - $597,000
2
Beds
1
Bath
1,960
Sq Ft
$250/Sq Ft
Est. Value
About This Home
This home is located at 604 Otis Johnson Rd, Pittsboro, NC 27312 and is currently estimated at $489,268, approximately $249 per square foot. 604 Otis Johnson Rd is a home located in Chatham County with nearby schools including Silk Hope School and Jordan Matthews High.
Ownership History
Date
Name
Owned For
Owner Type
Purchase Details
Closed on
Dec 31, 1996
Bought by
Weaver Lou Ann M
Current Estimated Value
Create a Home Valuation Report for This Property
The Home Valuation Report is an in-depth analysis detailing your home's value as well as a comparison with similar homes in the area
Home Values in the Area
Average Home Value in this Area
Purchase History
| Date | Buyer | Sale Price | Title Company |
|---|---|---|---|
| Weaver Lou Ann M | -- | -- |
Source: Public Records
Tax History Compared to Growth
Tax History
| Year | Tax Paid | Tax Assessment Tax Assessment Total Assessment is a certain percentage of the fair market value that is determined by local assessors to be the total taxable value of land and additions on the property. | Land | Improvement |
|---|---|---|---|---|
| 2025 | $2,422 | $302,290 | $220,365 | $81,925 |
| 2024 | $2,422 | $200,738 | $147,915 | $52,823 |
| 2023 | $1,925 | $200,738 | $147,915 | $52,823 |
| 2022 | $1,751 | $200,738 | $147,915 | $52,823 |
| 2021 | $1,751 | $200,738 | $147,915 | $52,823 |
| 2020 | $1,709 | $194,865 | $106,610 | $88,255 |
| 2019 | $1,709 | $194,865 | $106,610 | $88,255 |
| 2018 | $1,627 | $194,865 | $106,610 | $88,255 |
| 2017 | $1,607 | $194,865 | $106,610 | $88,255 |
| 2016 | $1,528 | $181,926 | $125,424 | $56,502 |
| 2015 | $1,506 | $181,926 | $125,424 | $56,502 |
| 2014 | $1,506 | $181,926 | $125,424 | $56,502 |
| 2013 | -- | $181,926 | $125,424 | $56,502 |
Source: Public Records
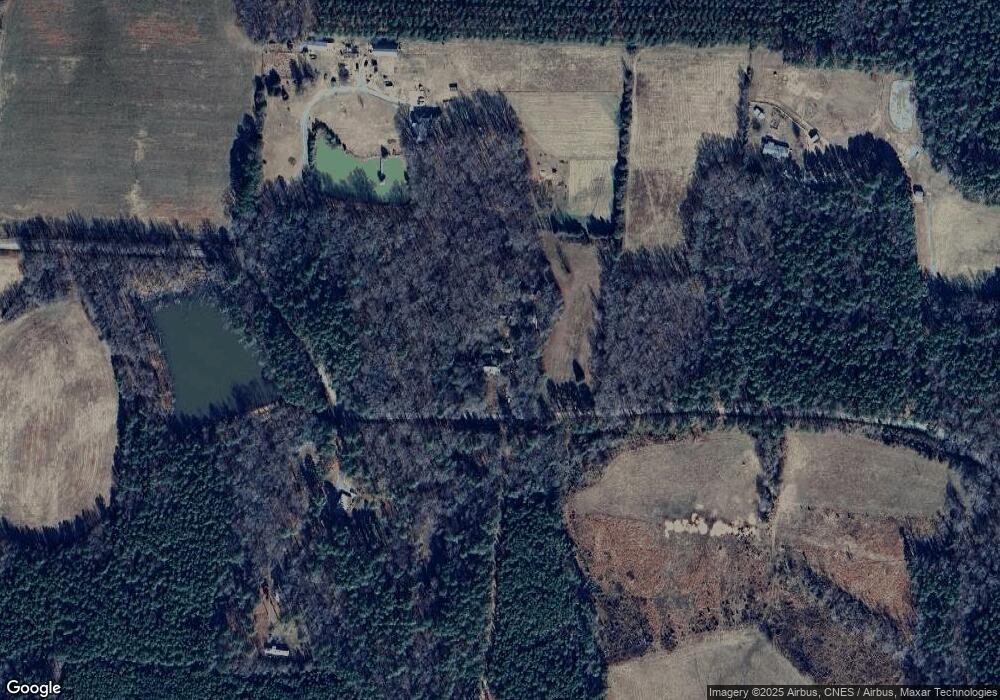
Map
Nearby Homes
- 476 Pete Thomas Rd
- 0 Pete Thomas Rd
- 4322 Russell Rd
- 00 Bowman Bare Rd
- 3880 L Lawrence Trail
- 9402 N Carolina 87
- 97 Fox Oak Trail
- 1684 Castle Rock Farm Rd
- 4058 Whispering Oaks Ct
- 8450 Perry Rd
- 0 Henderson Tanyard Rd Unit 10112548
- 0 Henderson Tanyard Rd Unit 100522009
- 884 Windsor Rd
- 220 Epps Clark Rd
- 000 Windsor Rd
- 754 & 0 Epps Clark Rd
- 754 Epps Clark Rd
- 169 Elsa Jane Ln
- 5065 Harrier Dr
- 5055 Harrier Dr
- 790 Otis Johnson Rd
- 430 Otis Johnson Rd
- 430 Otis Johnson Rd
- 705 Otis Johnson Rd
- 368 Otis Johnson Rd
- 192 Otis Johnson Rd
- 192 Otis Johnson Rd
- 978 Otis Johnson Rd
- 0 Otis Johnson Rd Unit 1900251
- 000 Otis Johnson Rd
- 0 Otis Johnson Rd Unit TR2191480
- 0 Otis Johnson Rd Unit 2357627
- 0 Otis Johnson Rd Unit 2 1900251
- TBD Otis Johnson Rd
- 0 Otis Johnson Rd
- 1049 Pete Thomas Rd
- 2886 Pete Thomas Rd
- 2000 Pete Thomas Rd
- 1130 Pete Thomas Rd
- 1208 Otis Johnson Rd