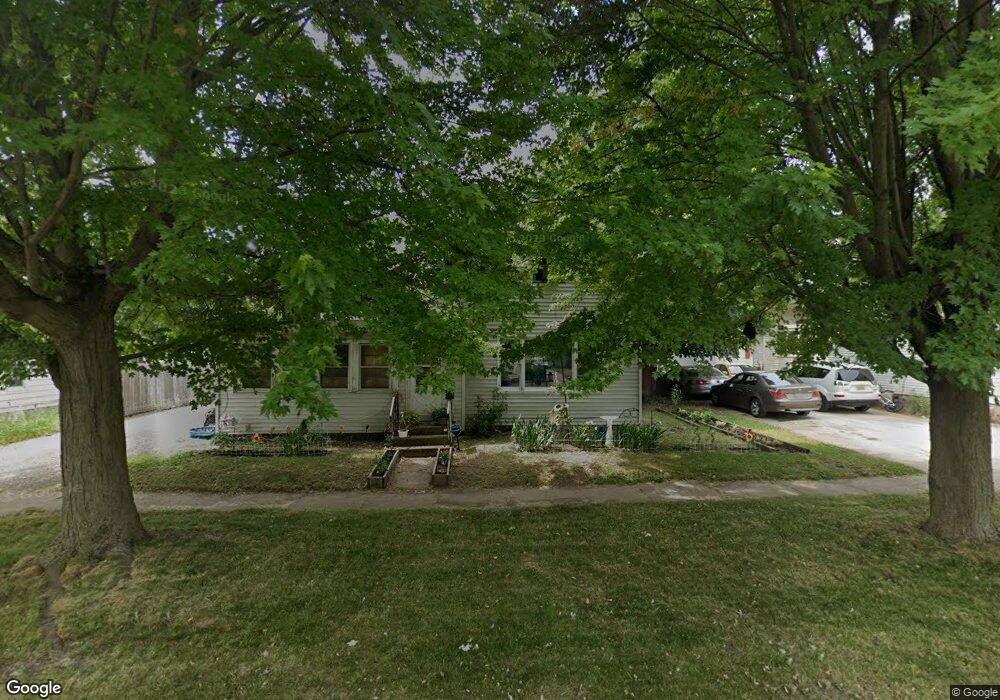
604 W West St Sturgis, MI 49091
Estimated Value: $148,000 - $155,000
4
Beds
1
Bath
1,403
Sq Ft
$109/Sq Ft
Est. Value
About This Home
This home is located at 604 W West St, Sturgis, MI 49091 and is currently estimated at $152,335, approximately $108 per square foot. 604 W West St is a home located in St. Joseph County with nearby schools including Sturgis High School, Trinity Lutheran School, and St John's Lutheran School.
Ownership History
Date
Name
Owned For
Owner Type
Purchase Details
Closed on
Aug 28, 2017
Sold by
Contract Management Inc
Bought by
Wiley Harry
Current Estimated Value
Purchase Details
Closed on
Jan 28, 2005
Sold by
Contract Management Inc
Bought by
Wiley Harry
Purchase Details
Closed on
Jan 31, 2004
Sold by
Bouwens Tony
Bought by
Penn Holly
Purchase Details
Closed on
Aug 12, 2003
Sold by
Contract Management Inc
Bought by
Bouwens Anthony-Ctr
Purchase Details
Closed on
Jul 31, 2003
Sold by
Kane Sean and James Judi-Ctr
Bought by
Contract Management Inc
Purchase Details
Closed on
Jun 9, 2003
Sold by
Kane Sean and James Judi-Ctr
Purchase Details
Closed on
Oct 1, 2002
Sold by
Kane Sean-Ctr
Bought by
Kane Sean and James Judi-Ctr
Purchase Details
Closed on
Aug 9, 2001
Sold by
Hough Construction
Bought by
Kane
Purchase Details
Closed on
Jun 6, 2001
Sold by
Holcomb Mike-Ctr
Bought by
Hough Douglas Construction Llc
Purchase Details
Closed on
Jan 11, 2000
Sold by
Hough
Bought by
Holcomb
Purchase Details
Closed on
Jan 1, 1901
Create a Home Valuation Report for This Property
The Home Valuation Report is an in-depth analysis detailing your home's value as well as a comparison with similar homes in the area
Home Values in the Area
Average Home Value in this Area
Purchase History
| Date | Buyer | Sale Price | Title Company |
|---|---|---|---|
| Wiley Harry | -- | Attorney | |
| Wiley Harry | -- | -- | |
| Penn Holly | -- | -- | |
| Bouwens Anthony-Ctr | $45,500 | -- | |
| Contract Management Inc | -- | -- | |
| -- | -- | -- | |
| Kane Sean | -- | -- | |
| Kane | -- | -- | |
| Hough Douglas Construction Llc | -- | -- | |
| Holcomb | -- | -- | |
| -- | -- | -- |
Source: Public Records
Tax History Compared to Growth
Tax History
| Year | Tax Paid | Tax Assessment Tax Assessment Total Assessment is a certain percentage of the fair market value that is determined by local assessors to be the total taxable value of land and additions on the property. | Land | Improvement |
|---|---|---|---|---|
| 2025 | $1,168 | $56,000 | $5,000 | $51,000 |
| 2024 | $972 | $51,300 | $4,400 | $46,900 |
| 2023 | $943 | $44,100 | $4,400 | $39,700 |
| 2022 | $869 | $38,300 | $4,100 | $34,200 |
| 2021 | $1,037 | $33,700 | $4,000 | $29,700 |
| 2020 | $1,025 | $30,100 | $3,100 | $27,000 |
| 2019 | $1,006 | $26,500 | $3,600 | $22,900 |
| 2018 | $905 | $23,900 | $2,700 | $21,200 |
| 2017 | $886 | $21,600 | $21,600 | $0 |
| 2016 | -- | $21,000 | $21,000 | $0 |
| 2015 | -- | $21,100 | $0 | $0 |
| 2014 | -- | $25,800 | $25,800 | $0 |
| 2012 | -- | $25,400 | $25,400 | $0 |
Source: Public Records
Map
Nearby Homes
- 212 N Orange St
- 600 Saint Joseph St
- 202 N Clay St
- 203 Grove St
- 210 Grove St
- 200 Broadus St
- 411 Wenzel Ave
- 26865 Us Highway 12
- 607 N Nottawa St
- 701 N Nottawa St
- 416 Sturgis St
- 402 N 4th St
- 702 S Orange St
- 105 Jean St
- 605 E West St
- 607 George St
- 302 E Electric Ct
- 602 Jean Ave
- 405 Jean St
- 405 Michigan Ave