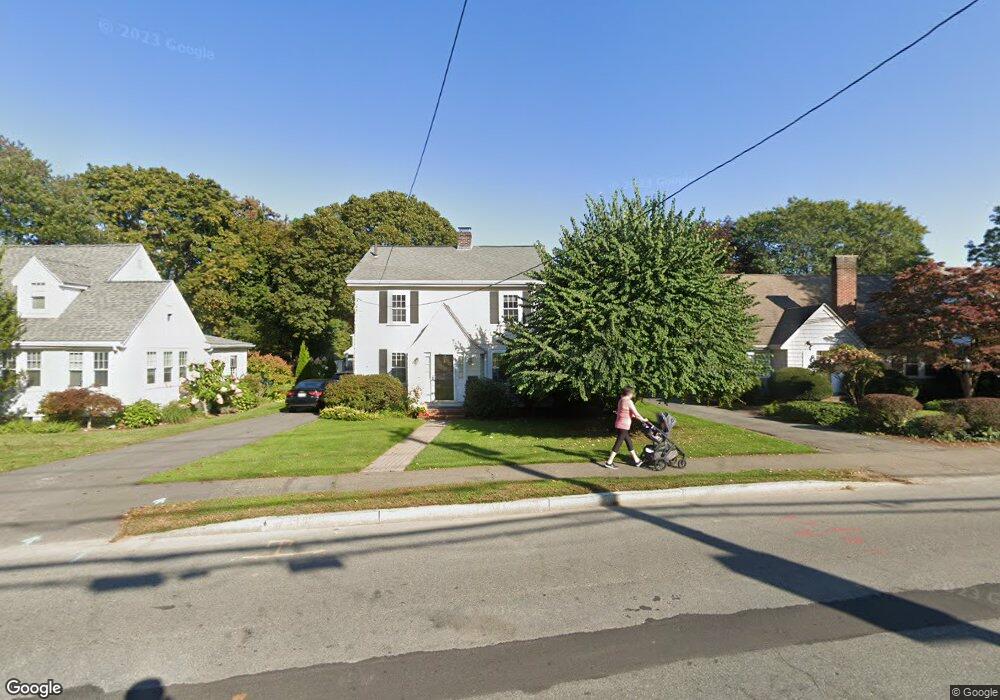
604 Webster St Needham Heights, MA 02494
Estimated Value: $1,121,000 - $1,336,000
3
Beds
2
Baths
919
Sq Ft
$1,344/Sq Ft
Est. Value
About This Home
This home is located at 604 Webster St, Needham Heights, MA 02494 and is currently estimated at $1,235,101, approximately $1,343 per square foot. 604 Webster St is a home located in Norfolk County with nearby schools including Mitchell Elementary School, High Rock Middle School, and Pollard Middle School.
Ownership History
Date
Name
Owned For
Owner Type
Purchase Details
Closed on
Dec 17, 2013
Sold by
Finklestein Seth P
Bought by
Seth P Finklestein T and Finklestein Seth P
Current Estimated Value
Purchase Details
Closed on
Oct 26, 2001
Sold by
Ounanian Douglas W and Ounanian Jane D
Bought by
Finklestein Seth P
Home Financials for this Owner
Home Financials are based on the most recent Mortgage that was taken out on this home.
Original Mortgage
$362,400
Interest Rate
6.86%
Mortgage Type
Purchase Money Mortgage
Purchase Details
Closed on
Jun 1, 1995
Sold by
Trahanas Peter S and Trahanas Annette
Bought by
Dunanian Douglas W
Home Financials for this Owner
Home Financials are based on the most recent Mortgage that was taken out on this home.
Original Mortgage
$200,000
Interest Rate
8.2%
Mortgage Type
Purchase Money Mortgage
Purchase Details
Closed on
Jul 24, 1992
Sold by
Wilkinson Harold C and Wilkinson Mildred L
Bought by
Trahanas Peter S and Trahanas Annette
Home Financials for this Owner
Home Financials are based on the most recent Mortgage that was taken out on this home.
Original Mortgage
$136,000
Interest Rate
8.49%
Mortgage Type
Purchase Money Mortgage
Create a Home Valuation Report for This Property
The Home Valuation Report is an in-depth analysis detailing your home's value as well as a comparison with similar homes in the area
Home Values in the Area
Average Home Value in this Area
Purchase History
| Date | Buyer | Sale Price | Title Company |
|---|---|---|---|
| Seth P Finklestein T | -- | -- | |
| Finklestein Seth P | $453,500 | -- | |
| Dunanian Douglas W | $257,000 | -- | |
| Trahanas Peter S | $170,000 | -- |
Source: Public Records
Mortgage History
| Date | Status | Borrower | Loan Amount |
|---|---|---|---|
| Previous Owner | Trahanas Peter S | $286,618 | |
| Previous Owner | Finklestein Seth P | $362,400 | |
| Previous Owner | Trahanas Peter S | $200,000 | |
| Previous Owner | Trahanas Peter S | $15,000 | |
| Previous Owner | Trahanas Peter S | $136,000 |
Source: Public Records
Tax History
| Year | Tax Paid | Tax Assessment Tax Assessment Total Assessment is a certain percentage of the fair market value that is determined by local assessors to be the total taxable value of land and additions on the property. | Land | Improvement |
|---|---|---|---|---|
| 2025 | $10,015 | $944,800 | $766,400 | $178,400 |
| 2024 | $9,180 | $733,200 | $547,400 | $185,800 |
| 2023 | $9,380 | $719,300 | $547,400 | $171,900 |
| 2022 | $8,625 | $645,100 | $480,100 | $165,000 |
| 2021 | $8,406 | $645,100 | $480,100 | $165,000 |
| 2020 | $8,091 | $647,800 | $480,200 | $167,600 |
| 2019 | $7,435 | $600,100 | $436,600 | $163,500 |
| 2018 | $7,129 | $600,100 | $436,600 | $163,500 |
| 2017 | $6,928 | $582,700 | $436,600 | $146,100 |
| 2016 | $6,724 | $582,700 | $436,600 | $146,100 |
| 2015 | $6,579 | $582,700 | $436,600 | $146,100 |
| 2014 | $6,230 | $535,200 | $396,900 | $138,300 |
Source: Public Records
Map
Nearby Homes
- 638 Webster St
- 638 Webster St Unit 638
- 510 Webster St
- 19 Oakland Ave Unit 19
- 19 Highland Ct Unit 19
- 58 Morton St
- 36 Otis St Unit 36
- 190 Brookline St
- 17 Lindbergh Ave
- 7 West St
- 40 High St
- 447 Hillside Ave
- 193 Garden St
- 100 Rosemary Way Unit 129
- 385 Hillside Ave
- 385 Hillside Ave Unit 385
- 3 Crescent Rd
- 28 Mercer Rd
- 100 Bradford St
- 68 Brookline St
- 608 Webster St
- 598 Webster St
- 614 Webster St
- 594 Webster St
- 349 Brookline St
- 14 Fairlawn St
- 18 Fairlawn St
- 194 Lindbergh Ave
- 202 Lindbergh Ave
- 345 Brookline St
- 622 Webster St
- 622 Webster St
- 595 Webster St
- 190 Lindbergh Ave
- 354 Brookline St
- 591 Webster St
- 628 Webster St
- 184 Lindbergh Ave
- 203 Lindbergh Ave
- 17 Fairlawn St
Your Personal Tour Guide
Ask me questions while you tour the home.