Estimated Value: $303,000 - $316,000
3
Beds
2
Baths
1,396
Sq Ft
$223/Sq Ft
Est. Value
About This Home
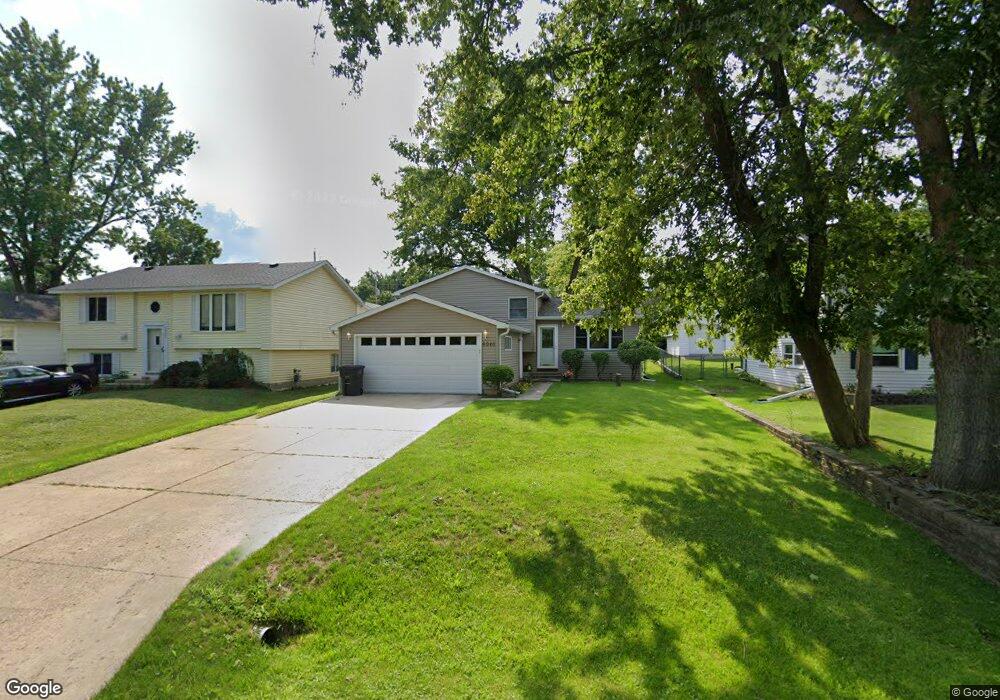
This home is located at 6040 239th Ave, Salem, WI 53168 and is currently estimated at $311,661, approximately $223 per square foot. 6040 239th Ave is a home located in Kenosha County with nearby schools including Salem Elementary School and Central High School.
Ownership History
Date
Name
Owned For
Owner Type
Purchase Details
Closed on
Sep 13, 2005
Sold by
Ameriquest Mortgage Co
Bought by
Meyer Ralph D and Atterberry Kimberly D
Current Estimated Value
Home Financials for this Owner
Home Financials are based on the most recent Mortgage that was taken out on this home.
Original Mortgage
$23,250
Outstanding Balance
$13,695
Interest Rate
7.5%
Mortgage Type
Adjustable Rate Mortgage/ARM
Estimated Equity
$297,966
Purchase Details
Closed on
Apr 27, 2005
Sold by
Vickers Dale E and Vickers Dena C
Bought by
Ameriquest Mortgage Co
Create a Home Valuation Report for This Property
The Home Valuation Report is an in-depth analysis detailing your home's value as well as a comparison with similar homes in the area
Home Values in the Area
Average Home Value in this Area
Purchase History
| Date | Buyer | Sale Price | Title Company |
|---|---|---|---|
| Meyer Ralph D | $155,000 | None Available | |
| Ameriquest Mortgage Co | $156,600 | None Available |
Source: Public Records
Mortgage History
| Date | Status | Borrower | Loan Amount |
|---|---|---|---|
| Open | Meyer Ralph D | $23,250 |
Source: Public Records
Tax History Compared to Growth
Tax History
| Year | Tax Paid | Tax Assessment Tax Assessment Total Assessment is a certain percentage of the fair market value that is determined by local assessors to be the total taxable value of land and additions on the property. | Land | Improvement |
|---|---|---|---|---|
| 2024 | $3,716 | $264,500 | $26,500 | $238,000 |
| 2023 | $3,147 | $264,500 | $26,500 | $238,000 |
| 2022 | $3,497 | $210,500 | $21,500 | $189,000 |
| 2021 | $3,189 | $210,500 | $21,500 | $189,000 |
| 2020 | $3,189 | $163,000 | $15,000 | $148,000 |
| 2019 | $3,148 | $163,000 | $15,000 | $148,000 |
| 2018 | $3,741 | $163,000 | $15,000 | $148,000 |
| 2017 | $2,853 | $129,500 | $15,000 | $114,500 |
| 2016 | $3,386 | $129,500 | $15,000 | $114,500 |
| 2015 | $2,839 | $129,500 | $15,000 | $114,500 |
| 2014 | $4,477 | $129,500 | $15,000 | $114,500 |
Source: Public Records
Map
Nearby Homes