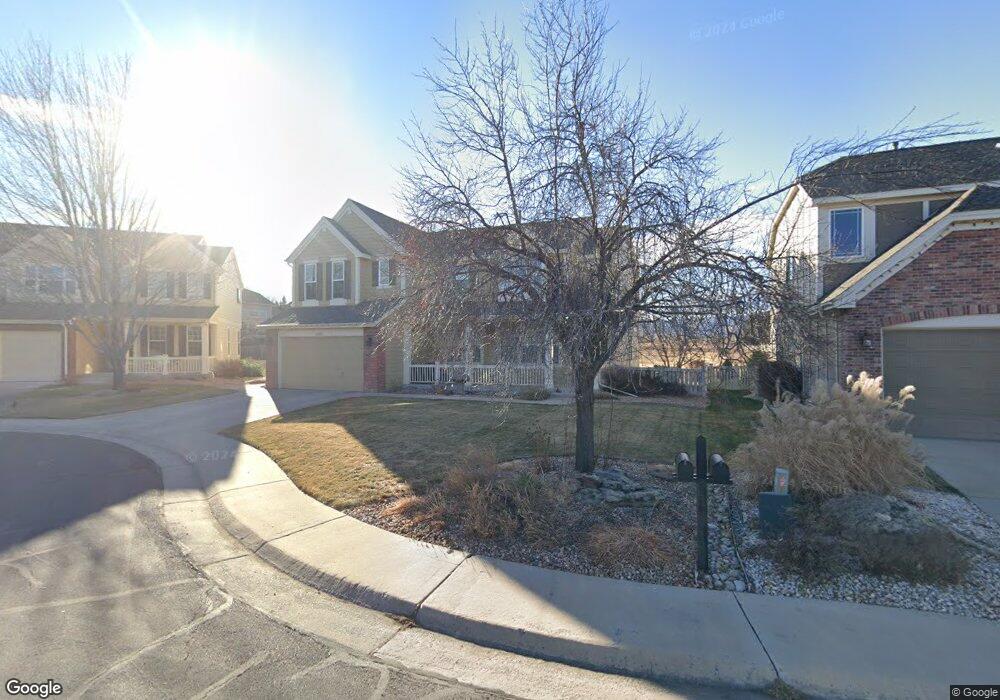
6041 Deframe Ct Arvada, CO 80004
Ralston Valley NeighborhoodEstimated Value: $1,024,000 - $1,118,000
3
Beds
4
Baths
4,128
Sq Ft
$257/Sq Ft
Est. Value
About This Home
This home is located at 6041 Deframe Ct, Arvada, CO 80004 and is currently estimated at $1,061,885, approximately $257 per square foot. 6041 Deframe Ct is a home located in Jefferson County with nearby schools including Fremont Elementary School, Drake Junior High School, and Arvada West High School.
Ownership History
Date
Name
Owned For
Owner Type
Purchase Details
Closed on
May 18, 2021
Sold by
Werbylo Richard W and Werbylo Linda M
Bought by
Werbylo Richard W and Werbylo Linda M
Current Estimated Value
Purchase Details
Closed on
Jun 25, 2014
Sold by
Theisen Carole J and Lehnerz Michael
Bought by
Werbylo Richard W and Werbylo Linda M
Purchase Details
Closed on
Apr 14, 2000
Sold by
Village Homes Of Colorado Inc
Bought by
Lehnerz Michael and Theisen Carole J
Home Financials for this Owner
Home Financials are based on the most recent Mortgage that was taken out on this home.
Original Mortgage
$252,700
Interest Rate
8%
Create a Home Valuation Report for This Property
The Home Valuation Report is an in-depth analysis detailing your home's value as well as a comparison with similar homes in the area
Home Values in the Area
Average Home Value in this Area
Purchase History
| Date | Buyer | Sale Price | Title Company |
|---|---|---|---|
| Werbylo Richard W | -- | None Available | |
| Werbylo Richard W | $560,000 | Guardian Title | |
| Lehnerz Michael | $327,925 | Land Title |
Source: Public Records
Mortgage History
| Date | Status | Borrower | Loan Amount |
|---|---|---|---|
| Previous Owner | Lehnerz Michael | $252,700 |
Source: Public Records
Tax History
| Year | Tax Paid | Tax Assessment Tax Assessment Total Assessment is a certain percentage of the fair market value that is determined by local assessors to be the total taxable value of land and additions on the property. | Land | Improvement |
|---|---|---|---|---|
| 2024 | $6,054 | $62,411 | $24,917 | $37,494 |
| 2023 | $6,054 | $62,411 | $24,917 | $37,494 |
| 2022 | $4,790 | $48,907 | $18,489 | $30,418 |
| 2021 | $4,869 | $50,315 | $19,022 | $31,293 |
| 2020 | $4,602 | $47,693 | $18,044 | $29,649 |
| 2019 | $4,540 | $47,693 | $18,044 | $29,649 |
| 2018 | $4,258 | $43,485 | $13,224 | $30,261 |
| 2017 | $3,898 | $43,485 | $13,224 | $30,261 |
| 2016 | $3,843 | $40,386 | $9,358 | $31,028 |
| 2015 | $3,581 | $40,386 | $9,358 | $31,028 |
| 2014 | $3,581 | $35,366 | $9,456 | $25,910 |
Source: Public Records
Map
Nearby Homes
- 6060 Deframe Ct
- 12321 W 58th Dr
- 6329 Braun Cir
- 5276 Flora Way
- 5316 Flora Way
- 6262 Braun Cir
- 6363 Cole Ln
- 5726 Fig Ct
- 6369 Cole Ln
- 13030 W 58th Ave
- 13812 W 64th Place
- 5683 Fig Way
- 13155 W 63rd Place
- 13750 W 65th Ave
- 13400 W 65th Ave
- 6409 Zang St Unit A
- 14880 W 58th Ave
- 6128 Xenon St
- 12924 W 64th Dr Unit B
- 12344 W 58th Place
- 6051 Deframe Ct
- 6031 Deframe Ct
- 6021 Deframe Ct
- 6011 Deframe Ct
- 6020 Deframe Ct
- 13727 W 59th Place
- 13757 W 59th Place
- 6071 Deframe Ct
- 13697 W 59th Place
- 6001 Deframe Ct
- 6042 Devinney Way
- 6052 Devinney Way
- 13777 W 59th Place
- 6032 Devinney Way
- 13687 W 59th Place
- 6081 Deframe Ct
- 6070 Deframe Ct
- 6000 Deframe Ct
- 6053 Deframe Ct
- 6010 Deframe Ct