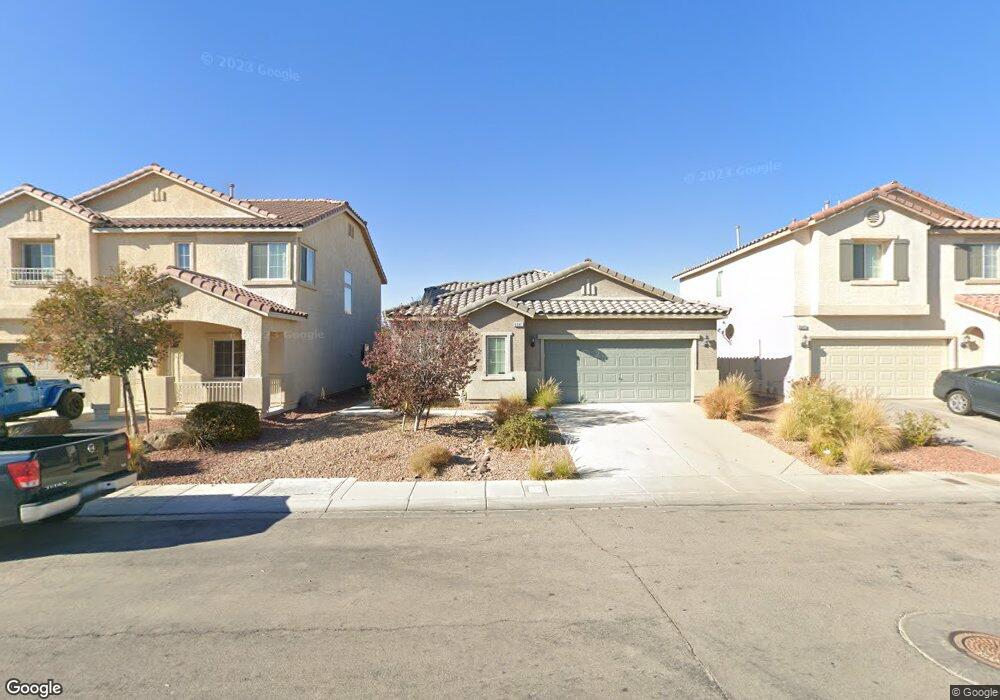
6041 Leaping Foal St North Las Vegas, NV 89081
Northridge NeighborhoodEstimated Value: $374,196 - $408,000
4
Beds
2
Baths
1,656
Sq Ft
$237/Sq Ft
Est. Value
About This Home
This home is located at 6041 Leaping Foal St, North Las Vegas, NV 89081 and is currently estimated at $392,049, approximately $236 per square foot. 6041 Leaping Foal St is a home located in Clark County with nearby schools including Don E. Hayden Elementary School, Ruby Duncan Elementary School, and Carroll M. Johnston STEM Academy of Environmental Studies.
Ownership History
Date
Name
Owned For
Owner Type
Purchase Details
Closed on
Sep 6, 2023
Sold by
Rivera Armando
Bought by
Rivera Keren
Current Estimated Value
Home Financials for this Owner
Home Financials are based on the most recent Mortgage that was taken out on this home.
Original Mortgage
$272,475
Outstanding Balance
$266,532
Interest Rate
6.81%
Mortgage Type
New Conventional
Estimated Equity
$125,517
Purchase Details
Closed on
Dec 1, 2004
Sold by
Chan Nick
Bought by
Mclaughlin Dwight and Mclaughlin Shirley
Home Financials for this Owner
Home Financials are based on the most recent Mortgage that was taken out on this home.
Original Mortgage
$100,000
Interest Rate
5.74%
Mortgage Type
Unknown
Purchase Details
Closed on
Sep 22, 2004
Sold by
U S Home Corp
Bought by
Chan Nick
Home Financials for this Owner
Home Financials are based on the most recent Mortgage that was taken out on this home.
Original Mortgage
$209,900
Interest Rate
5.8%
Mortgage Type
New Conventional
Create a Home Valuation Report for This Property
The Home Valuation Report is an in-depth analysis detailing your home's value as well as a comparison with similar homes in the area
Home Values in the Area
Average Home Value in this Area
Purchase History
| Date | Buyer | Sale Price | Title Company |
|---|---|---|---|
| Rivera Keren | -- | Equity Title | |
| Rivera Keren | $363,300 | Equity Title | |
| Mclaughlin Dwight | $265,000 | First Amer Title Co Of Nv | |
| Chan Nick | $220,950 | North American Title Company |
Source: Public Records
Mortgage History
| Date | Status | Borrower | Loan Amount |
|---|---|---|---|
| Open | Rivera Keren | $272,475 | |
| Previous Owner | Mclaughlin Dwight | $100,000 | |
| Previous Owner | Chan Nick | $209,900 |
Source: Public Records
Tax History Compared to Growth
Tax History
| Year | Tax Paid | Tax Assessment Tax Assessment Total Assessment is a certain percentage of the fair market value that is determined by local assessors to be the total taxable value of land and additions on the property. | Land | Improvement |
|---|---|---|---|---|
| 2025 | $1,838 | $106,859 | $32,550 | $74,309 |
| 2024 | $1,702 | $106,859 | $32,550 | $74,309 |
| 2023 | $1,133 | $101,344 | $31,150 | $70,194 |
| 2022 | $1,577 | $88,794 | $24,850 | $63,944 |
| 2021 | $1,460 | $82,353 | $21,700 | $60,653 |
| 2020 | $1,353 | $81,075 | $21,000 | $60,075 |
| 2019 | $1,268 | $77,210 | $18,200 | $59,010 |
| 2018 | $1,210 | $63,460 | $12,950 | $50,510 |
| 2017 | $1,804 | $53,794 | $11,900 | $41,894 |
| 2016 | $1,133 | $49,227 | $9,800 | $39,427 |
| 2015 | $1,130 | $42,616 | $7,700 | $34,916 |
| 2014 | $1,097 | $31,734 | $5,250 | $26,484 |
Source: Public Records
Map
Nearby Homes
- 329 Gemstone Hill Ave
- 320 Gemstone Hill Ave
- 5929 Caddy Ridge St
- 6032 Draft Horse Dr
- 5908 Big Horn View St
- 6249 Disruptor St Unit 2
- 6229 Disruptor St Unit 2
- Paxton Plan at Heritage Square
- Alina Plan at Heritage Square
- Nadia Plan at Heritage Square
- 6219 Mangler St Unit 1
- 5929 Pink Chaff St
- 909 Nevada Blaze Ave
- 6009 Arbor Crest St
- 6084 Silken Saddle St
- 305 Snow Dome Ave
- 5824 Gemstone Peak St
- 6030 Hidden Summit St
- 5835 Running Horse Dr
- 6020 Old Vines St
- 6037 Leaping Foal St
- 6045 Leaping Foal St
- 6033 Leaping Foal St
- 6049 Leaping Foal St
- 6049 Leaping Foal St Unit none
- 6029 Leaping Foal St
- 6053 Leaping Foal St
- 6040 Leaping Foal St
- 6044 Leaping Foal St
- 6036 Leaping Foal St
- 6025 Leaping Foal St
- 6057 Leaping Foal St
- 6048 Leaping Foal St
- 6032 Leaping Foal St
- 6052 Leaping Foal St Unit 1C
- 6028 Leaping Foal St
- 6021 Leaping Foal St
- 6104 Ozark Hike St
- 6028 Peacock Pine St
- 6056 Leaping Foal St