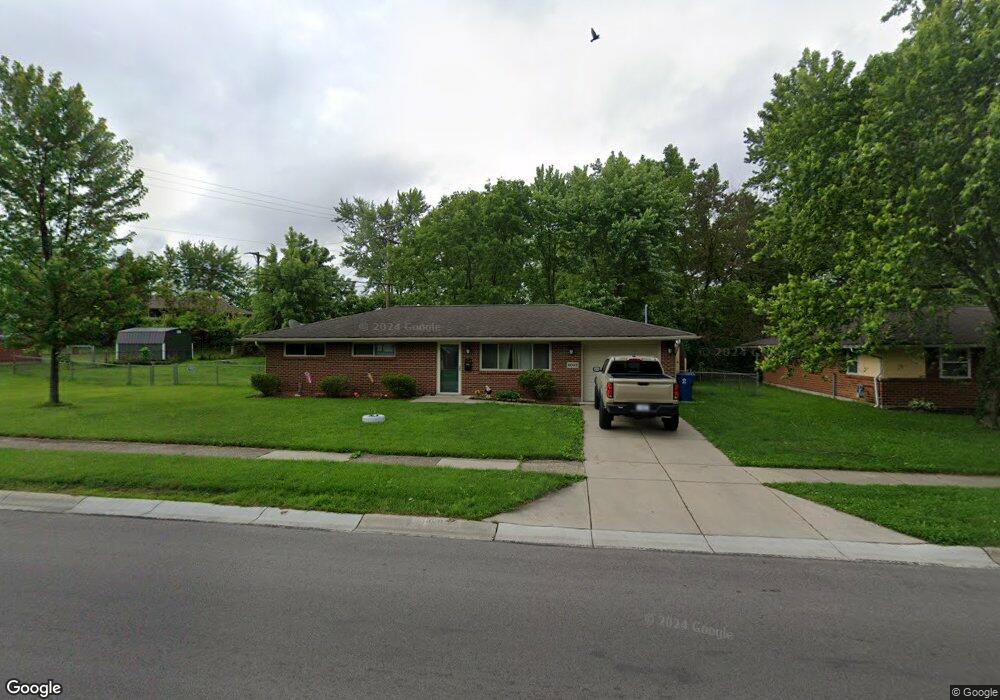
6042 Longford Rd Dayton, OH 45424
Estimated Value: $173,000 - $192,000
3
Beds
2
Baths
1,080
Sq Ft
$172/Sq Ft
Est. Value
About This Home
This home is located at 6042 Longford Rd, Dayton, OH 45424 and is currently estimated at $185,465, approximately $171 per square foot. 6042 Longford Rd is a home located in Montgomery County with nearby schools including Wayne High School and Huber Heights Christian Academy.
Ownership History
Date
Name
Owned For
Owner Type
Purchase Details
Closed on
Mar 22, 2012
Sold by
Country Corp
Bought by
Mcgarvey Stoney
Current Estimated Value
Home Financials for this Owner
Home Financials are based on the most recent Mortgage that was taken out on this home.
Original Mortgage
$9,700
Outstanding Balance
$6,690
Interest Rate
3.88%
Mortgage Type
Unknown
Estimated Equity
$178,775
Purchase Details
Closed on
Aug 11, 2010
Sold by
Federal Home Loan Mortgage Corporation
Bought by
County Corp
Purchase Details
Closed on
May 24, 2010
Sold by
Vanmeter Marla L
Bought by
Federal Home Loan Mortgage Corp
Purchase Details
Closed on
Nov 30, 2004
Sold by
Walker Donna R and Walker Bruce N
Bought by
Vanmeter Marla L
Home Financials for this Owner
Home Financials are based on the most recent Mortgage that was taken out on this home.
Original Mortgage
$74,800
Interest Rate
5.77%
Mortgage Type
Fannie Mae Freddie Mac
Create a Home Valuation Report for This Property
The Home Valuation Report is an in-depth analysis detailing your home's value as well as a comparison with similar homes in the area
Home Values in the Area
Average Home Value in this Area
Purchase History
| Date | Buyer | Sale Price | Title Company |
|---|---|---|---|
| Mcgarvey Stoney | -- | None Available | |
| County Corp | -- | Attorney | |
| Federal Home Loan Mortgage Corp | $46,000 | None Available | |
| Vanmeter Marla L | $74,800 | None Available |
Source: Public Records
Mortgage History
| Date | Status | Borrower | Loan Amount |
|---|---|---|---|
| Open | Mcgarvey Stoney | $9,700 | |
| Open | Mcgarvey Stoney | $85,360 | |
| Previous Owner | Vanmeter Marla L | $74,800 |
Source: Public Records
Tax History Compared to Growth
Tax History
| Year | Tax Paid | Tax Assessment Tax Assessment Total Assessment is a certain percentage of the fair market value that is determined by local assessors to be the total taxable value of land and additions on the property. | Land | Improvement |
|---|---|---|---|---|
| 2024 | $2,349 | $45,360 | $10,150 | $35,210 |
| 2023 | $2,349 | $45,360 | $10,150 | $35,210 |
| 2022 | $2,225 | $31,260 | $7,000 | $24,260 |
| 2021 | $2,263 | $31,260 | $7,000 | $24,260 |
| 2020 | $2,265 | $31,260 | $7,000 | $24,260 |
| 2019 | $2,294 | $28,060 | $7,000 | $21,060 |
| 2018 | $2,302 | $28,060 | $7,000 | $21,060 |
| 2017 | $2,110 | $28,060 | $7,000 | $21,060 |
| 2016 | $2,001 | $25,920 | $7,000 | $18,920 |
| 2015 | $1,976 | $25,920 | $7,000 | $18,920 |
| 2014 | $1,976 | $25,920 | $7,000 | $18,920 |
| 2012 | -- | $26,820 | $8,750 | $18,070 |
Source: Public Records
Map
Nearby Homes
- 7126 Mandrake Dr
- 6529 Harshmanville Rd
- 6800 Cicero Ct
- 6673 Celestine St
- 6245 Longford Rd
- 5904 Troy Villa Blvd Unit 20051
- 5631 Longford Rd
- 5926 Chambersburg Rd
- 5873 Troy Villa Blvd Unit 20174
- 5637 Troy Villa Blvd Unit 20088
- 6946 Hubbard Dr
- 7371 Damascus Dr
- 6601 Grovehill Dr
- 6413 Alter Rd
- 5625 Copley Cir
- 6447 Highbury Rd
- 5248 Tilbury Rd
- 6150 Taylorsville Rd
- 5582 Camerford Dr
- 6717 Alter Rd
- 6050 Longford Rd
- 6034 Longford Rd
- 5947 Leycross Dr
- 5955 Leycross Dr
- 6058 Longford Rd
- 5940 Leycross Dr
- 6035 Longford Rd
- 6026 Longford Rd
- 6043 Longford Rd
- 6027 Longford Rd
- 5963 Leycross Dr
- 5988 Longford Rd
- 6076 Longford Rd
- 6051 Longford Rd
- 7006 Claybeck Dr
- 7012 Claybeck Dr
- 5971 Leycross Dr
- 7000 Claybeck Dr
- 5980 Longford Rd
- 5948 Leycross Dr