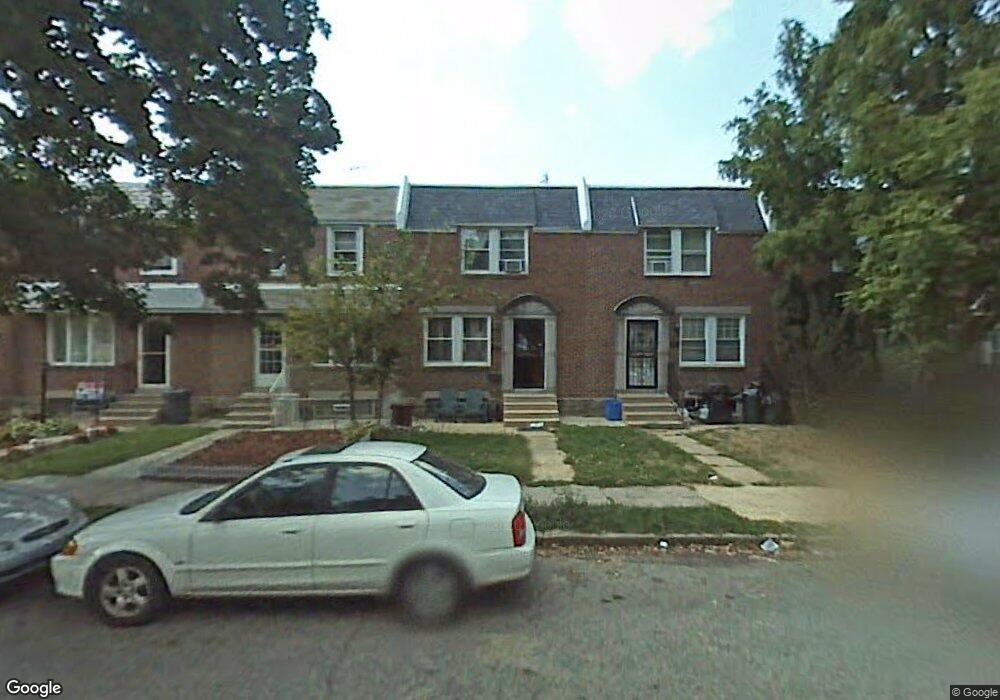
6044 Hasbrook Ave Philadelphia, PA 19111
Lawncrest NeighborhoodEstimated Value: $198,000 - $231,000
3
Beds
1
Bath
1,188
Sq Ft
$180/Sq Ft
Est. Value
About This Home
This home is located at 6044 Hasbrook Ave, Philadelphia, PA 19111 and is currently estimated at $213,434, approximately $179 per square foot. 6044 Hasbrook Ave is a home located in Philadelphia County with nearby schools including Benjamin Franklin Elementary School, Samuel Fels High School, and Mast Community Charter Ii.
Ownership History
Date
Name
Owned For
Owner Type
Purchase Details
Closed on
Mar 14, 2005
Sold by
Louissaint Andre N
Bought by
Osne Marie Izanie
Current Estimated Value
Purchase Details
Closed on
Nov 19, 2004
Sold by
Baker Marvin A and Scott Carla
Bought by
Louissaint Andre N
Home Financials for this Owner
Home Financials are based on the most recent Mortgage that was taken out on this home.
Original Mortgage
$90,000
Interest Rate
8.5%
Mortgage Type
New Conventional
Purchase Details
Closed on
Oct 4, 2000
Sold by
Mccabe Jacqueline H and Hennessy Jacqueline J
Bought by
Baker Marvin A and Scott Carla
Home Financials for this Owner
Home Financials are based on the most recent Mortgage that was taken out on this home.
Original Mortgage
$60,200
Interest Rate
7.88%
Purchase Details
Closed on
Oct 27, 1995
Sold by
Mccabe Jacqueline H and Mccabe John H
Bought by
Mccabe Jacqueline H and Hennessy Jacqueline J
Create a Home Valuation Report for This Property
The Home Valuation Report is an in-depth analysis detailing your home's value as well as a comparison with similar homes in the area
Home Values in the Area
Average Home Value in this Area
Purchase History
| Date | Buyer | Sale Price | Title Company |
|---|---|---|---|
| Osne Marie Izanie | -- | -- | |
| Louissaint Andre N | $100,000 | -- | |
| Baker Marvin A | $66,900 | First American Title Ins Co | |
| Mccabe Jacqueline H | -- | -- |
Source: Public Records
Mortgage History
| Date | Status | Borrower | Loan Amount |
|---|---|---|---|
| Previous Owner | Louissaint Andre N | $90,000 | |
| Previous Owner | Baker Marvin A | $60,200 |
Source: Public Records
Tax History Compared to Growth
Tax History
| Year | Tax Paid | Tax Assessment Tax Assessment Total Assessment is a certain percentage of the fair market value that is determined by local assessors to be the total taxable value of land and additions on the property. | Land | Improvement |
|---|---|---|---|---|
| 2025 | $2,238 | $198,700 | $39,740 | $158,960 |
| 2024 | $2,238 | $198,700 | $39,740 | $158,960 |
| 2023 | $2,238 | $159,900 | $31,980 | $127,920 |
| 2022 | $1,617 | $159,900 | $31,980 | $127,920 |
| 2021 | $1,617 | $0 | $0 | $0 |
| 2020 | $1,617 | $0 | $0 | $0 |
| 2019 | $1,551 | $0 | $0 | $0 |
| 2018 | $1,541 | $0 | $0 | $0 |
| 2017 | $1,541 | $0 | $0 | $0 |
| 2016 | $1,541 | $0 | $0 | $0 |
| 2015 | $1,475 | $0 | $0 | $0 |
| 2014 | -- | $110,100 | $23,846 | $86,254 |
| 2012 | -- | $15,488 | $2,508 | $12,980 |
Source: Public Records
Map
Nearby Homes
- 6046 Hasbrook Ave
- 252 Benner St
- 6143 Reach St
- 209 Stearly St
- 6162 Hasbrook Ave
- 6030 Newtown Ave
- 354 Devereaux Ave
- 441 Van Kirk St
- 344 Van Kirk St
- 423 Alcott St
- 454 Devereaux Ave
- 6245 Oakley St
- 6101 Colgate St
- 307 E Cheltenham Ave
- 5815 Newtown Ave
- 6334 Hasbrook Ave
- 5901 Colgate St
- 5943 Malta St
- 6324 Shelbourne St
- 5939 Malta St
- 6042 Hasbrook Ave
- 6048 Hasbrook Ave
- 6040 Hasbrook Ave
- 6050 Hasbrook Ave
- 6036 Hasbrook Ave
- 6052 Hasbrook Ave
- 6034 Hasbrook Ave
- 6032 Hasbrook Ave
- 6039 Reach St
- 6041 Reach St
- 6037 Reach St
- 6035 Reach St
- 6043 Reach St
- 6045 Reach St
- 6030 Hasbrook Ave
- 6033 Reach St
- 6031 Reach St
- 6047 Reach St
- 6028 Hasbrook Ave
- 6029 Reach St