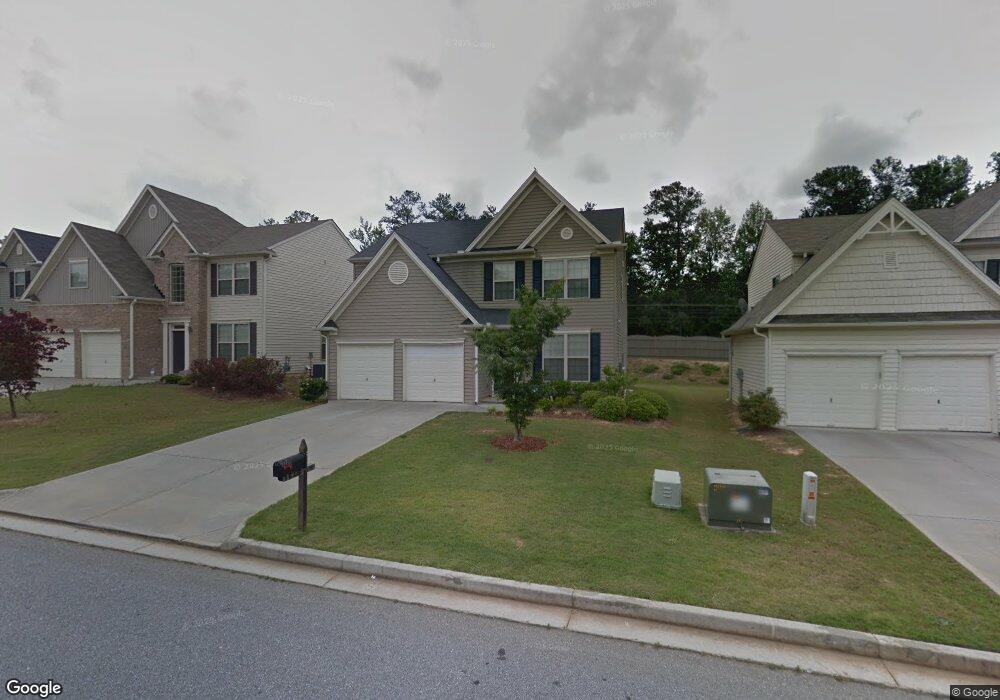
6045 Hemperly Rd Atlanta, GA 30349
Estimated Value: $274,000 - $336,000
4
Beds
3
Baths
2,168
Sq Ft
$140/Sq Ft
Est. Value
About This Home
This home is located at 6045 Hemperly Rd, Atlanta, GA 30349 and is currently estimated at $302,514, approximately $139 per square foot. 6045 Hemperly Rd is a home located in Fulton County with nearby schools including Bethune Elementary School, Mcnair Middle School, and Banneker High School.
Ownership History
Date
Name
Owned For
Owner Type
Purchase Details
Closed on
Jul 8, 2021
Sold by
Mupr 3 Assets Llc
Bought by
Cpi Amherst Sfr Program Ii Owner Llc
Current Estimated Value
Purchase Details
Closed on
Dec 17, 2020
Sold by
Srmz 2 Llc
Bought by
Mupr 3 Assets Llc
Purchase Details
Closed on
Mar 20, 2019
Sold by
Jeff 1 Llc
Bought by
Srmz 2 Llc
Purchase Details
Closed on
Mar 1, 2019
Sold by
Lhf 4 Assets Llc
Bought by
Jeff 1 Llc
Purchase Details
Closed on
Jan 2, 2018
Sold by
Walker Christine
Bought by
Lhf 4 Assets Llc
Purchase Details
Closed on
Sep 27, 2007
Sold by
Venture Homes Inc
Bought by
Whitaker Christine
Home Financials for this Owner
Home Financials are based on the most recent Mortgage that was taken out on this home.
Original Mortgage
$177,219
Interest Rate
6.44%
Mortgage Type
FHA
Create a Home Valuation Report for This Property
The Home Valuation Report is an in-depth analysis detailing your home's value as well as a comparison with similar homes in the area
Home Values in the Area
Average Home Value in this Area
Purchase History
| Date | Buyer | Sale Price | Title Company |
|---|---|---|---|
| Cpi Amherst Sfr Program Ii Owner Llc | $254,198 | -- | |
| Mupr 3 Assets Llc | $248,422 | -- | |
| Srmz 2 Llc | $166,659 | -- | |
| Jeff 1 Llc | -- | -- | |
| Lhf 4 Assets Llc | $117,000 | -- | |
| Whitaker Christine | $180,700 | -- |
Source: Public Records
Mortgage History
| Date | Status | Borrower | Loan Amount |
|---|---|---|---|
| Previous Owner | Whitaker Christine | $177,219 |
Source: Public Records
Tax History Compared to Growth
Tax History
| Year | Tax Paid | Tax Assessment Tax Assessment Total Assessment is a certain percentage of the fair market value that is determined by local assessors to be the total taxable value of land and additions on the property. | Land | Improvement |
|---|---|---|---|---|
| 2025 | $4,263 | $110,680 | $30,040 | $80,640 |
| 2023 | $3,124 | $110,680 | $30,040 | $80,640 |
| 2022 | $2,607 | $66,480 | $9,360 | $57,120 |
| 2021 | $2,195 | $64,520 | $9,080 | $55,440 |
| 2020 | $2,594 | $63,760 | $8,960 | $54,800 |
| 2019 | $2,167 | $54,880 | $8,080 | $46,800 |
| 2018 | $1,315 | $53,600 | $7,920 | $45,680 |
| 2017 | $1,347 | $33,040 | $7,400 | $25,640 |
| 2016 | $1,347 | $33,040 | $7,400 | $25,640 |
| 2015 | $1,351 | $33,040 | $7,400 | $25,640 |
| 2014 | $1,425 | $33,040 | $7,400 | $25,640 |
Source: Public Records
Map
Nearby Homes
- 6041 Hemperly Rd
- 6037 Hemperly Rd
- 6148 Hemperly Rd
- 0 Flat Shoals Rd Unit 10214526
- 0 Flat Shoals Rd Unit 7513975
- 2764 Ocean Valley Dr
- 2765 Ocean Valley Dr
- 2890 Kayla Ct
- 6265 Gemstone Ct
- 2802 Ocean Valley Dr
- 6305 Emerald Pointe Cir
- 2765 Old Farm Rd
- 6022 Centennial Run
- 2686 Carriage Ln
- 2739 Carriage Ln
- 0 Carriage Ln Unit 7525115
- 2970 Harper Valley Dr
- 2801 Carriage Ln
- 6049 Hemperly Rd
- 6053 Hemperly Rd
- 6048 Hemperly Rd
- 6044 Hemperly Rd
- 6036 Hemperly Rd
- 6061 Hemperly Rd
- 630 Morning Dr
- 6032 Hemperly Rd
- 625 Morning Dr
- 0 Morning Dr
- 6065 Hemperly Rd
- 6176 Hemperly Rd
- 0 Hemperly Rd Unit 7362520
- 0 Hemperly Rd Unit 7058484
- 0 Hemperly Rd Unit 7061261
- 0 Hemperly Rd Unit 3170485
- 0 Hemperly Rd Unit 7610904
- 0 Hemperly Rd Unit 8823485
- 0 Hemperly Rd Unit 8668428