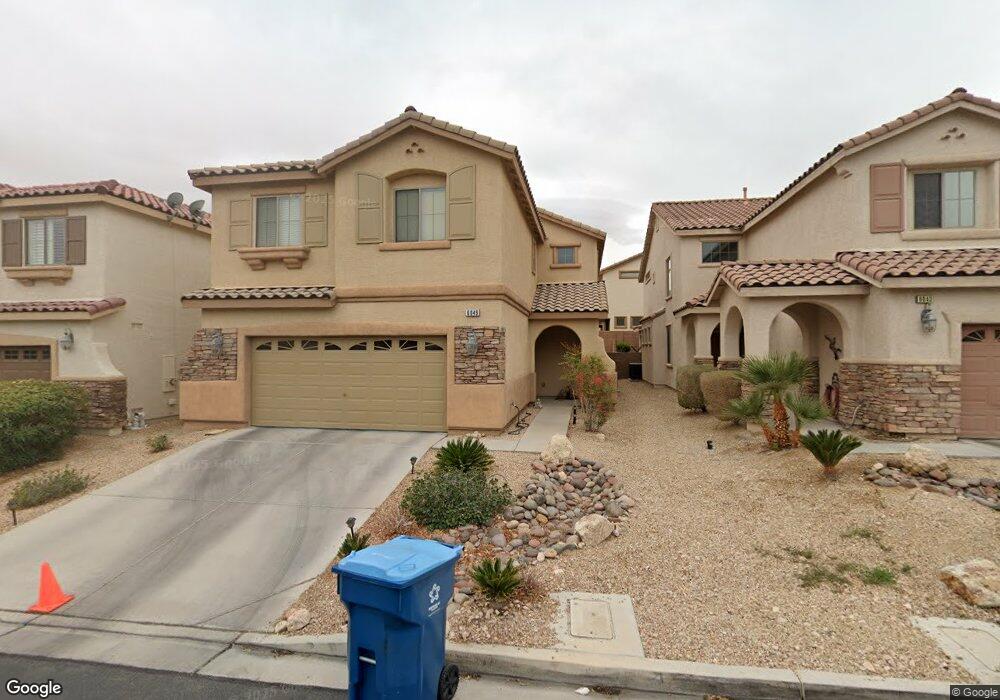
6049 Doroca St Las Vegas, NV 89148
Estimated Value: $509,446 - $570,000
4
Beds
3
Baths
2,533
Sq Ft
$214/Sq Ft
Est. Value
About This Home
This home is located at 6049 Doroca St, Las Vegas, NV 89148 and is currently estimated at $543,112, approximately $214 per square foot. 6049 Doroca St is a home located in Clark County with nearby schools including Kathy L. Batterman Elementary School, Victoria Fertitta Middle School, and Sierra Vista High School.
Ownership History
Date
Name
Owned For
Owner Type
Purchase Details
Closed on
Dec 2, 2020
Sold by
Clark Cathie C
Bought by
Clark Cathie C and Clark Cathie C
Current Estimated Value
Purchase Details
Closed on
Aug 6, 2009
Sold by
Aurora Loan Services Llc
Bought by
Clark Cathie C
Home Financials for this Owner
Home Financials are based on the most recent Mortgage that was taken out on this home.
Original Mortgage
$196,377
Outstanding Balance
$128,625
Interest Rate
5.3%
Mortgage Type
Purchase Money Mortgage
Estimated Equity
$414,487
Purchase Details
Closed on
Jun 3, 2009
Sold by
Skinner Shannon L
Bought by
Aurora Loan Services Llc
Purchase Details
Closed on
Apr 3, 2007
Sold by
Cache I Llc
Bought by
Skinner Shannon L
Home Financials for this Owner
Home Financials are based on the most recent Mortgage that was taken out on this home.
Original Mortgage
$443,080
Interest Rate
8.77%
Mortgage Type
Unknown
Create a Home Valuation Report for This Property
The Home Valuation Report is an in-depth analysis detailing your home's value as well as a comparison with similar homes in the area
Home Values in the Area
Average Home Value in this Area
Purchase History
| Date | Buyer | Sale Price | Title Company |
|---|---|---|---|
| Clark Cathie C | -- | None Available | |
| Clark Cathie C | $200,000 | Silver State Title Company | |
| Aurora Loan Services Llc | $490,321 | Fidelity National Default So | |
| Skinner Shannon L | $443,080 | Red Rock Title & Escrow Co |
Source: Public Records
Mortgage History
| Date | Status | Borrower | Loan Amount |
|---|---|---|---|
| Open | Clark Cathie C | $196,377 | |
| Previous Owner | Skinner Shannon L | $443,080 |
Source: Public Records
Tax History Compared to Growth
Tax History
| Year | Tax Paid | Tax Assessment Tax Assessment Total Assessment is a certain percentage of the fair market value that is determined by local assessors to be the total taxable value of land and additions on the property. | Land | Improvement |
|---|---|---|---|---|
| 2025 | $2,650 | $143,594 | $40,950 | $102,644 |
| 2024 | $2,573 | $143,594 | $40,950 | $102,644 |
| 2023 | $2,573 | $132,816 | $36,225 | $96,591 |
| 2022 | $2,498 | $118,427 | $30,450 | $87,977 |
| 2021 | $2,426 | $110,753 | $27,300 | $83,453 |
| 2020 | $2,352 | $108,739 | $26,250 | $82,489 |
| 2019 | $2,324 | $104,293 | $23,100 | $81,193 |
| 2018 | $2,217 | $96,954 | $19,600 | $77,354 |
| 2017 | $2,857 | $97,410 | $19,250 | $78,160 |
| 2016 | $2,076 | $92,735 | $15,050 | $77,685 |
| 2015 | $2,071 | $91,131 | $14,700 | $76,431 |
| 2014 | $2,011 | $66,894 | $7,350 | $59,544 |
Source: Public Records
Map
Nearby Homes
- 9691 Loud Water Way
- 6125 Powdermill St
- 9580 Magnificent Ave
- 9709 Hawk Cliff Ave
- 9505 Delivery Ave
- 6169 Novelty St
- 5915 Poplar Tree St Unit 7
- 9460 Magnificent Ave
- 10015 Wonderful Day Dr Unit 8
- 9628 Scrub Jay Ct
- 10023 Liberty View Rd Unit 8
- 6234 Burrell Ct
- 6336 Fence Post St
- 5697 Tapestry Rose Ct
- 10105 Prattville Ave Unit 5
- 5736 Remy Rain St
- 10134 Reflection Brook Ave
- 10127 Clifton Forge Ave
- 9611 Aberdeen Ridge Ct
- 9750 Maple Sugar Leaf Place
- 6055 Doroca St
- 6043 Doroca St
- 6061 Doroca St
- 9737 Villa Cache Ct
- 6037 Doroca St
- 9738 Vista Cache Ct
- 9745 Villa Cache Ct
- 9746 Vista Cache Ct
- 6054 Doroca St
- 6048 Doroca St
- 6060 Doroca St
- 6042 Doroca St
- 6066 Doroca St
- 6036 Doroca St
- 6072 Doroca St
- 6072 Doroca St Unit none
- 9728 Villa Cache Ct
- 9720 Villa Cache Ct
- 6030 Doroca St