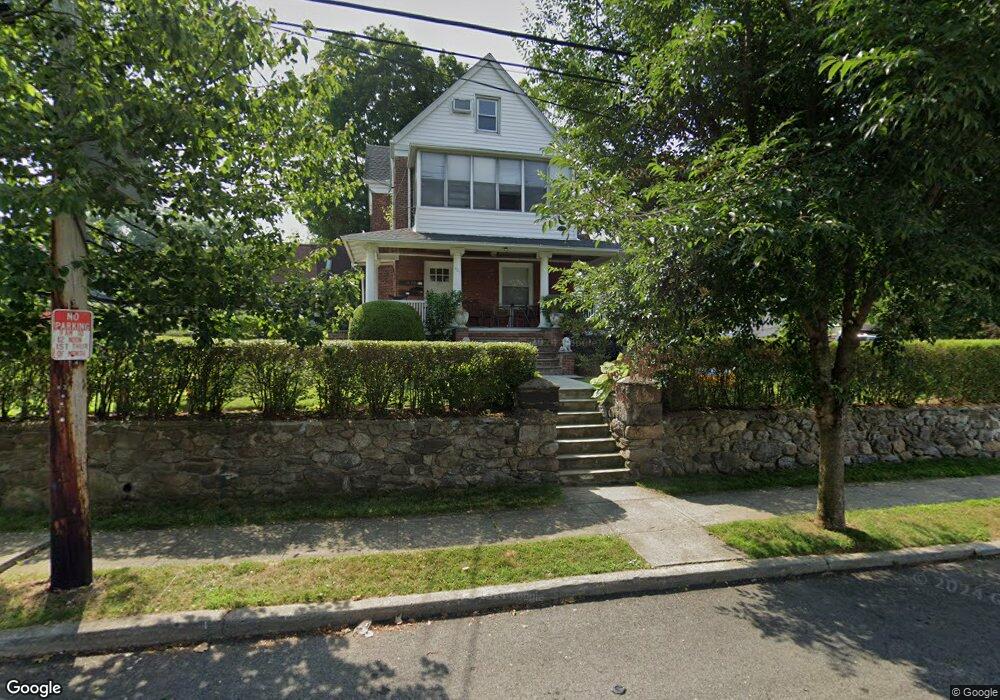
605 3rd St Unit A Mamaroneck, NY 10543
Estimated Value: $939,000 - $1,076,000
4
Beds
3
Baths
2,230
Sq Ft
$450/Sq Ft
Est. Value
About This Home
This home is located at 605 3rd St Unit A, Mamaroneck, NY 10543 and is currently estimated at $1,003,097, approximately $449 per square foot. 605 3rd St Unit A is a home located in Westchester County with nearby schools including F.E. Bellows Elementary School, Daniel Warren Elementary School, and Rye Neck Middle School.
Ownership History
Date
Name
Owned For
Owner Type
Purchase Details
Closed on
Aug 10, 2017
Sold by
Cangianni Joseph and Cangianni Dolores
Bought by
Weeks Christopher John and Weeks Craig C
Current Estimated Value
Home Financials for this Owner
Home Financials are based on the most recent Mortgage that was taken out on this home.
Original Mortgage
$550,000
Outstanding Balance
$453,194
Interest Rate
4.03%
Mortgage Type
New Conventional
Estimated Equity
$549,903
Purchase Details
Closed on
Jan 24, 2002
Sold by
Scampone Dean and Scampone Christopher
Bought by
Cangianni Joseph and Cangianni Dolores
Home Financials for this Owner
Home Financials are based on the most recent Mortgage that was taken out on this home.
Original Mortgage
$463,500
Interest Rate
7.01%
Mortgage Type
Unknown
Purchase Details
Closed on
Apr 7, 2000
Sold by
Jacowleff William S and Jacowleff Frances R
Bought by
Cad Development Corp
Create a Home Valuation Report for This Property
The Home Valuation Report is an in-depth analysis detailing your home's value as well as a comparison with similar homes in the area
Home Values in the Area
Average Home Value in this Area
Purchase History
We collect this data history from publicly available records. To have your information removed, we recommend requesting removal directly through your county’s website.
| Date | Buyer | Sale Price | Title Company |
|---|---|---|---|
| Weeks Christopher John | $770,000 | All New York Title | |
| Cangianni Joseph | $515,000 | Commonwealth Land Title Ins | |
| Cad Development Corp | $90,000 | -- |
Source: Public Records
Mortgage History
We collect this data history from publicly available records. To have your information removed, we recommend requesting removal directly through your county’s website.
| Date | Status | Borrower | Loan Amount |
|---|---|---|---|
| Open | Weeks Christopher John | $550,000 | |
| Previous Owner | Cangianni Joseph | $463,500 |
Source: Public Records
Tax History
| Year | Tax Paid | Tax Assessment Tax Assessment Total Assessment is a certain percentage of the fair market value that is determined by local assessors to be the total taxable value of land and additions on the property. | Land | Improvement |
|---|---|---|---|---|
| 2025 | $16,627 | $985,700 | $387,700 | $598,000 |
| 2024 | $22,402 | $929,900 | $387,700 | $542,200 |
| 2023 | $16,307 | $911,700 | $369,300 | $542,400 |
| 2022 | $16,068 | $860,100 | $369,300 | $490,800 |
| 2021 | $21,021 | $789,100 | $369,300 | $419,800 |
| 2020 | $19,153 | $789,100 | $369,300 | $419,800 |
| 2019 | $22,080 | $756,000 | $296,700 | $459,300 |
| 2018 | $10,118 | $702,600 | $290,900 | $411,700 |
| 2017 | $2,171 | $551,400 | $290,200 | $261,200 |
| 2016 | $15,526 | $518,300 | $255,900 | $262,400 |
| 2015 | -- | $491,000 | $243,600 | $247,400 |
| 2014 | -- | $481,100 | $241,400 | $239,700 |
| 2013 | -- | $462,500 | $222,800 | $239,700 |
Source: Public Records
Map
Nearby Homes
- 622 2nd St
- 720 Meadow St
- 525 3rd St
- 903 Howard Ave
- 629 Hillside Ave
- 737 Bradley St
- 640 Hillside Ave
- 514 N Wagner Ave
- 921 Jefferson Ave
- 623 Willow St
- 463 Beach Ave
- 27 Top of the Ridge Unit D9
- 925 Halstead Ave
- 1001 Halstead Ave
- 417 Wagner Ave
- 1304 Birch Hill Ln
- 420 Grant Terrace
- 206 Knollwood Ave
- 325 Frank Ave
- 319 Melbourne Ave
Your Personal Tour Guide
Ask me questions while you tour the home.