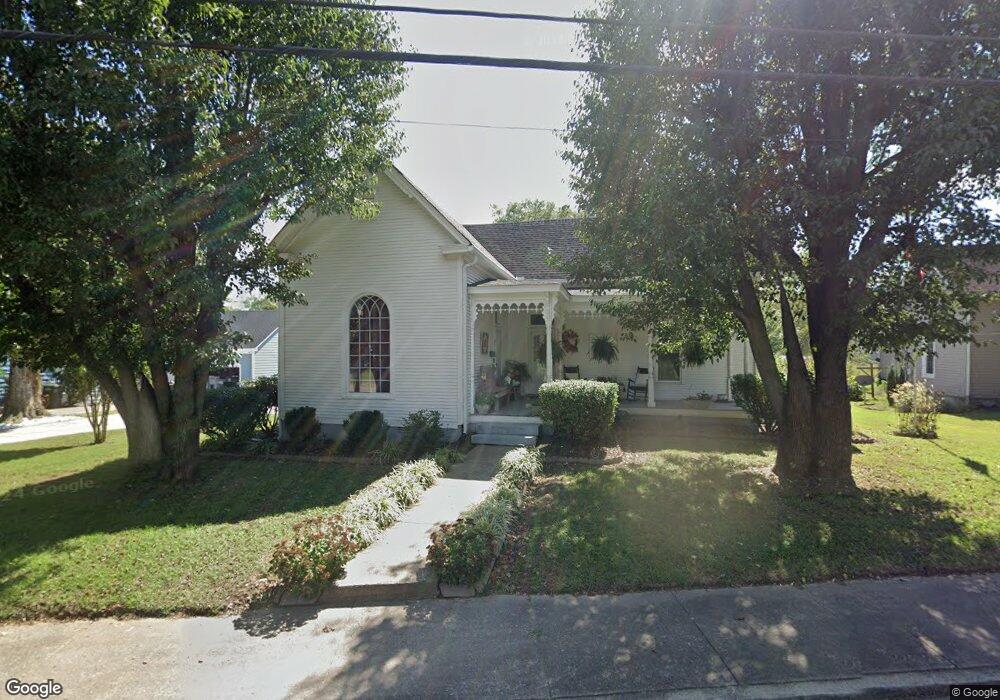
605 5th Ave E Springfield, TN 37172
Estimated Value: $292,106 - $338,000
Studio
2
Baths
2,160
Sq Ft
$149/Sq Ft
Est. Value
About This Home
This home is located at 605 5th Ave E, Springfield, TN 37172 and is currently estimated at $321,277, approximately $148 per square foot. 605 5th Ave E is a home located in Robertson County with nearby schools including Krisle Elementary School, Innovation Academy, and Springfield High School.
Ownership History
Date
Name
Owned For
Owner Type
Purchase Details
Closed on
Dec 26, 1996
Sold by
Alford James
Bought by
Lyon David Lee
Current Estimated Value
Home Financials for this Owner
Home Financials are based on the most recent Mortgage that was taken out on this home.
Original Mortgage
$35,000
Interest Rate
7.51%
Purchase Details
Closed on
Jun 30, 1994
Bought by
Alford James and Alford Jessie Delores
Purchase Details
Closed on
Oct 23, 1986
Bought by
Joynes Roger
Create a Home Valuation Report for This Property
The Home Valuation Report is an in-depth analysis detailing your home's value as well as a comparison with similar homes in the area
Home Values in the Area
Average Home Value in this Area
Purchase History
| Date | Buyer | Sale Price | Title Company |
|---|---|---|---|
| Lyon David Lee | $100,000 | -- | |
| Alford James | $21,000 | -- | |
| Joynes Roger | -- | -- |
Source: Public Records
Mortgage History
| Date | Status | Borrower | Loan Amount |
|---|---|---|---|
| Closed | Joynes Roger | $35,000 |
Source: Public Records
Tax History
| Year | Tax Paid | Tax Assessment Tax Assessment Total Assessment is a certain percentage of the fair market value that is determined by local assessors to be the total taxable value of land and additions on the property. | Land | Improvement |
|---|---|---|---|---|
| 2025 | -- | $70,775 | $16,250 | $54,525 |
| 2024 | -- | $70,775 | $16,250 | $54,525 |
| 2023 | $1,773 | $70,775 | $16,250 | $54,525 |
| 2022 | $1,374 | $37,650 | $5,500 | $32,150 |
| 2021 | $1,374 | $37,650 | $5,500 | $32,150 |
| 2020 | $1,374 | $37,650 | $5,500 | $32,150 |
| 2019 | $41,370 | $37,650 | $5,500 | $32,150 |
| 2018 | $1,374 | $37,650 | $5,500 | $32,150 |
| 2017 | $1,426 | $33,275 | $5,875 | $27,400 |
| 2016 | $1,426 | $33,275 | $5,875 | $27,400 |
| 2015 | $1,384 | $33,275 | $5,875 | $27,400 |
| 2014 | $1,384 | $33,275 | $5,875 | $27,400 |
Source: Public Records
Map
Nearby Homes
Your Personal Tour Guide
Ask me questions while you tour the home.