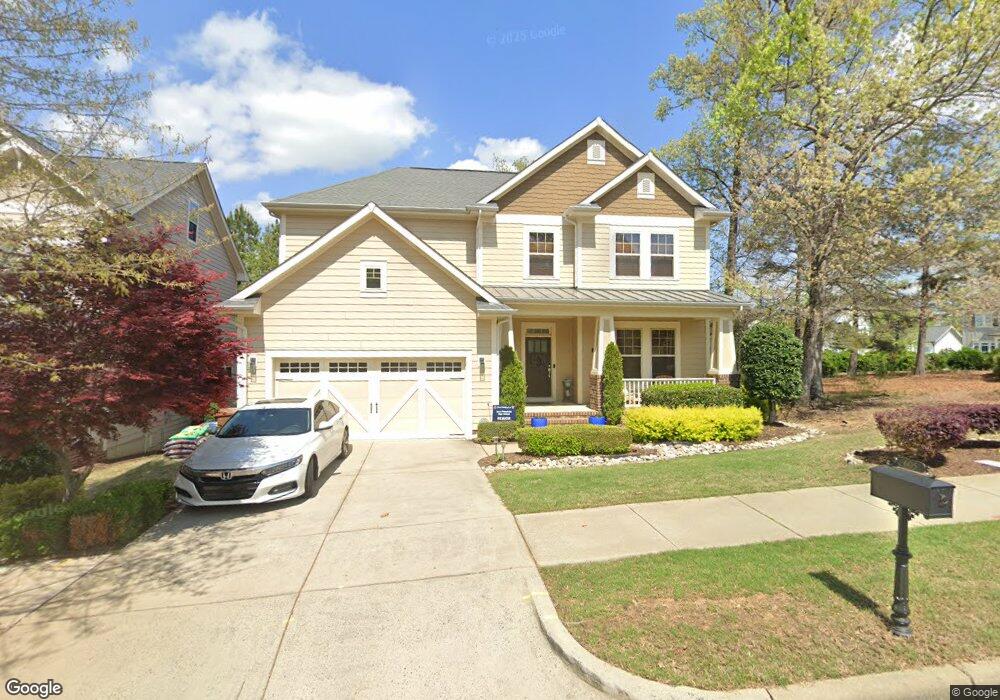
605 Ancient Oaks Dr Holly Springs, NC 27540
Estimated Value: $680,621 - $750,000
3
Beds
4
Baths
2,643
Sq Ft
$275/Sq Ft
Est. Value
About This Home
This home is located at 605 Ancient Oaks Dr, Holly Springs, NC 27540 and is currently estimated at $725,905, approximately $274 per square foot. 605 Ancient Oaks Dr is a home located in Wake County with nearby schools including Oakview Elementary School, Apex Friendship Middle School, and Apex Friendship High School.
Ownership History
Date
Name
Owned For
Owner Type
Purchase Details
Closed on
Jul 12, 2017
Sold by
Hancock Kenneth Bradley
Bought by
Hancock Elizabeth Jo
Current Estimated Value
Home Financials for this Owner
Home Financials are based on the most recent Mortgage that was taken out on this home.
Original Mortgage
$194,250
Outstanding Balance
$161,389
Interest Rate
3.89%
Mortgage Type
New Conventional
Estimated Equity
$564,516
Purchase Details
Closed on
Dec 28, 2012
Sold by
Weekley Homes Llc
Bought by
Hancock Kenneth B and Hancock Elizaeth Jo
Home Financials for this Owner
Home Financials are based on the most recent Mortgage that was taken out on this home.
Original Mortgage
$317,344
Outstanding Balance
$220,753
Interest Rate
3.38%
Mortgage Type
New Conventional
Estimated Equity
$505,152
Purchase Details
Closed on
Jun 22, 2010
Sold by
Twelve Oaks L L C
Bought by
Weekley Homes L P
Create a Home Valuation Report for This Property
The Home Valuation Report is an in-depth analysis detailing your home's value as well as a comparison with similar homes in the area
Home Values in the Area
Average Home Value in this Area
Purchase History
| Date | Buyer | Sale Price | Title Company |
|---|---|---|---|
| Hancock Elizabeth Jo | -- | None Available | |
| Hancock Kenneth B | $311,000 | None Available | |
| Weekley Homes L P | $308,000 | None Available |
Source: Public Records
Mortgage History
| Date | Status | Borrower | Loan Amount |
|---|---|---|---|
| Open | Hancock Elizabeth Jo | $194,250 | |
| Open | Hancock Kenneth B | $317,344 |
Source: Public Records
Tax History Compared to Growth
Tax History
| Year | Tax Paid | Tax Assessment Tax Assessment Total Assessment is a certain percentage of the fair market value that is determined by local assessors to be the total taxable value of land and additions on the property. | Land | Improvement |
|---|---|---|---|---|
| 2025 | $5,532 | $640,429 | $160,000 | $480,429 |
| 2024 | $5,508 | $640,429 | $160,000 | $480,429 |
| 2023 | $4,692 | $433,181 | $80,000 | $353,181 |
| 2022 | $4,530 | $433,181 | $80,000 | $353,181 |
| 2021 | $4,445 | $433,181 | $80,000 | $353,181 |
| 2020 | $4,445 | $433,181 | $80,000 | $353,181 |
| 2019 | $4,080 | $337,446 | $80,000 | $257,446 |
| 2018 | $3,688 | $337,446 | $80,000 | $257,446 |
| 2017 | $3,555 | $337,446 | $80,000 | $257,446 |
| 2016 | $3,506 | $337,446 | $80,000 | $257,446 |
| 2015 | $3,277 | $310,344 | $70,000 | $240,344 |
| 2014 | -- | $310,344 | $70,000 | $240,344 |
Source: Public Records
Map
Nearby Homes
- 621 Ancient Oaks Dr
- 108 Split Trunk Path
- 205 Mint Julep Way
- 113 Splendid Oak Ct
- 316 Fairway Vista Dr
- 417 Ancient Oaks Dr
- 116 Edgegrove Ln
- 817 Rambling Oaks Ln
- 120 Silver Bluff St
- 141 Sweet Vista Ln
- 1705 Green Oaks Pkwy
- Dilworth Plan at Regency at Holly Springs - Journey Collection
- Mallard Plan at Regency at Holly Springs - Journey Collection
- Devin Plan at Regency at Holly Springs - Excursion Collection
- Tahoma Plan at Regency at Holly Springs - Excursion Collection
- Trawick Plan at Regency at Holly Springs - Journey Collection
- Westview Plan at Regency at Holly Springs - Journey Collection
- Eden Plan at Regency at Holly Springs - Excursion Collection
- William Plan at Regency at Holly Springs - Excursion Collection
- Devin Elite Transitional Plan at Regency at Holly Springs - Excursion Collection
- 609 Ancient Oaks Dr
- 613 Ancient Oaks Dr
- 104 Quaker Meadows Ct
- 100 Quaker Meadows Ct
- 305 Rambling Oaks Ln
- 313 Rambling Oaks Ln
- 309 Rambling Oaks Ln
- 604 Ancient Oaks Dr
- 608 Ancient Oaks Dr
- 617 Ancient Oaks Dr
- 612 Ancient Oaks Dr
- 401 Rambling Oaks Ln
- 204 Quaker Meadows Ct
- 200 Quaker Meadows Ct
- 616 Ancient Oaks Dr
- 405 Rambling Oaks Ln
- 105 Duck Savannah Dr
- 620 Ancient Oaks Dr
- 625 Ancient Oaks Dr
- 409 Rambling Oaks Ln